-
The Forum works well on MOBILE devices without an app: Just go to: https://forum.tsptalk.com
-
Please read our AutoTracker policy on the IFT deadline and remaining active. Thanks!
-
$ - Premium Service Content (Info) | AutoTracker Monthly Winners | Is Gmail et al, Blocking Our emails?
Find us on: Facebook & X | Posting Copyrighted Material
-
Join the TSP Talk AutoTracker: How to Get Started | Login | Main AutoTracker Page
You are using an out of date browser. It may not display this or other websites correctly.
You should upgrade or use an alternative browser.
You should upgrade or use an alternative browser.
Bear Cave 2 (Bull Allowed)
- Thread starter robo
- Start date
robo
TSP Legend
- Reaction score
- 471
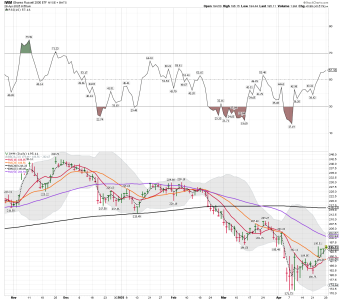
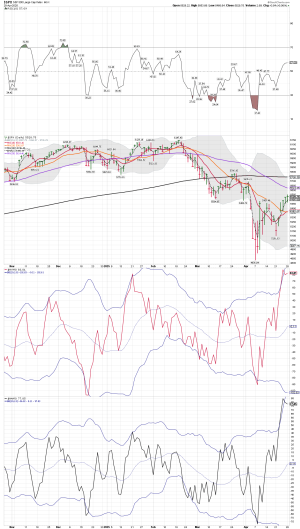
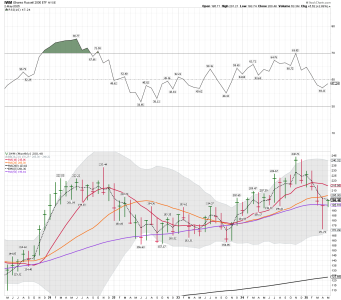
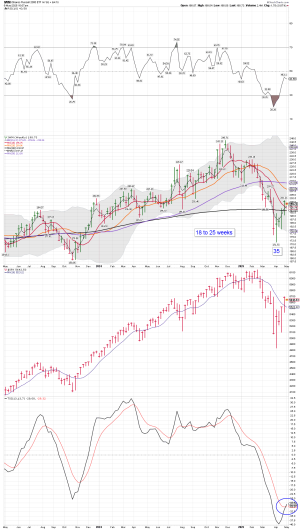
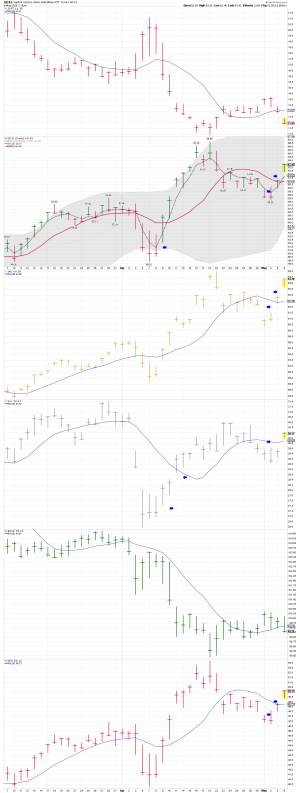
VXF daily: A nice start to the week.... We shall see if buyers will continue to come back in... The 50 day SMA is up next. VXF has moved back above the 3 day EMA, and the 10 and 20 day SMA.... A very nice Bullish move.
Watching the Small and Midcap charts, and waiting for the next news event.
Watching the Small and Midcap charts, and waiting for the next news event.
Attachments

Last edited:
robo
TSP Legend
- Reaction score
- 471
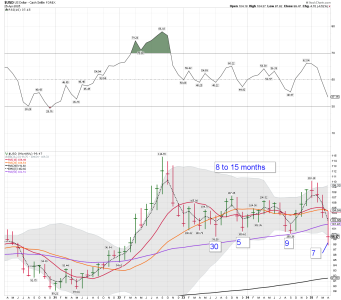
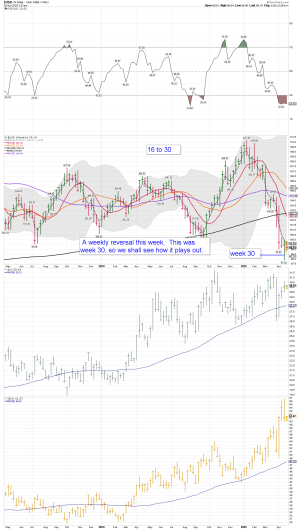
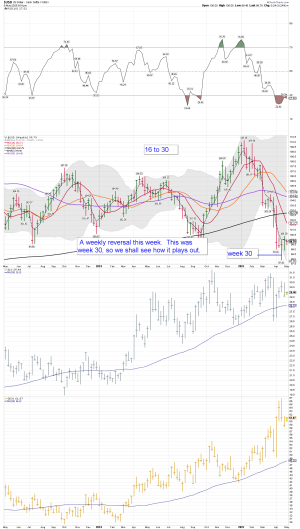
USD weekly chart: Is the ICL for the USD in? STBD.... LOL.... I know, another weekly chart for the USD from robo.... It remains an important chart in my opinion.

 www.goldenmeadow.eu
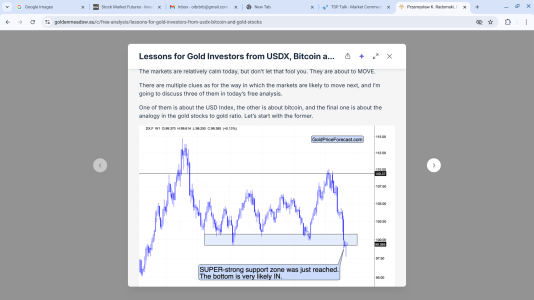
Lessons for Gold Investors from USDX, Bitcoin and Gold Stocks | Golden Meadow®
The markets are relatively calm today, but don’t let that fool you. They are about to MOVE. There are multiple clues as for the way in which the markets are likely to move next, and I’m going to discuss three of them in today’s free analysis. One of ...
Attachments
robo
TSP Legend
- Reaction score
- 471
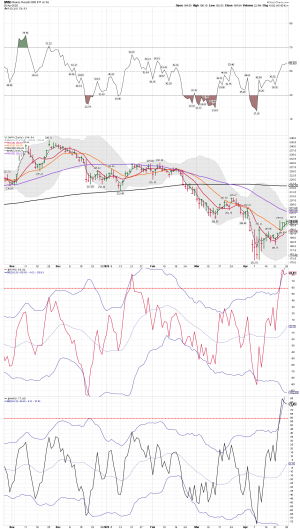
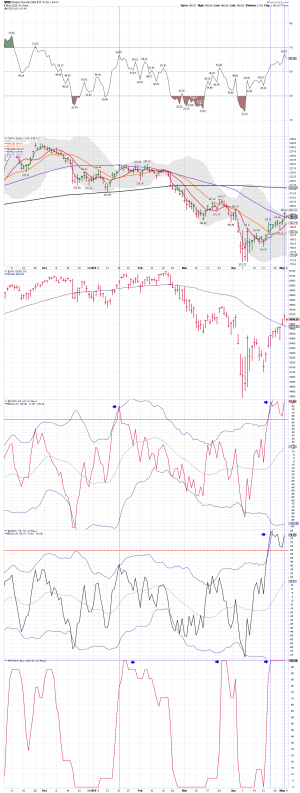
SPX and IWM daily: The 50 day SMA be up next. I'm currently flat....
We shall see how the Bull Trap plays out... STBD!
All those financial TV analysts who were preaching caution last Monday as the S&P was nearing 5100 are now talking bullish. “Get in now” they cheer as the index is trading 400 points higher.
Somehow, I suspect folks will regret that advice in the days ahead.
Last week’s action felt like a “bull trap.” That’s when reluctant bulls get coaxed back into the market just in time for the bear to take another swipe.
We shall see how the Bull Trap plays out... STBD!
Don’t Get Caught in the Bull Trap
The talking heads have flipped.All those financial TV analysts who were preaching caution last Monday as the S&P was nearing 5100 are now talking bullish. “Get in now” they cheer as the index is trading 400 points higher.
Somehow, I suspect folks will regret that advice in the days ahead.
Last week’s action felt like a “bull trap.” That’s when reluctant bulls get coaxed back into the market just in time for the bear to take another swipe.
Attachments
Last edited:
robo
TSP Legend
- Reaction score
- 471
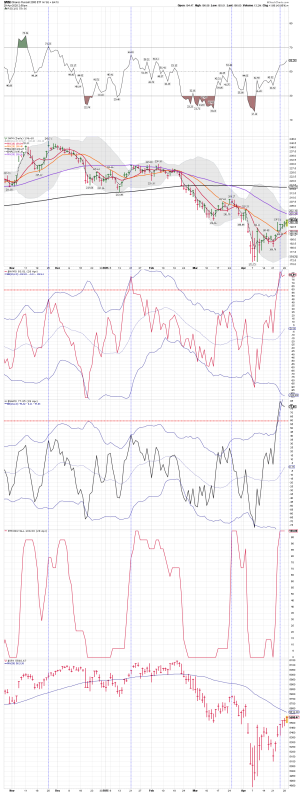
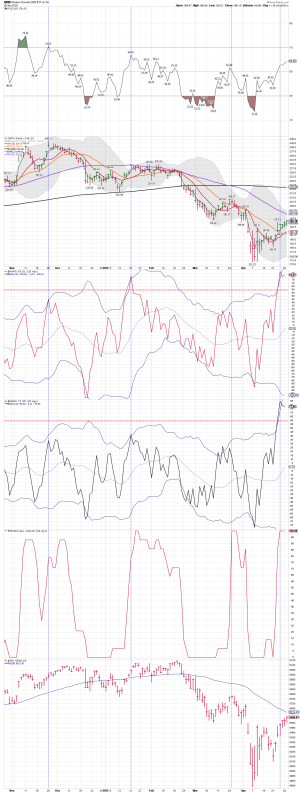
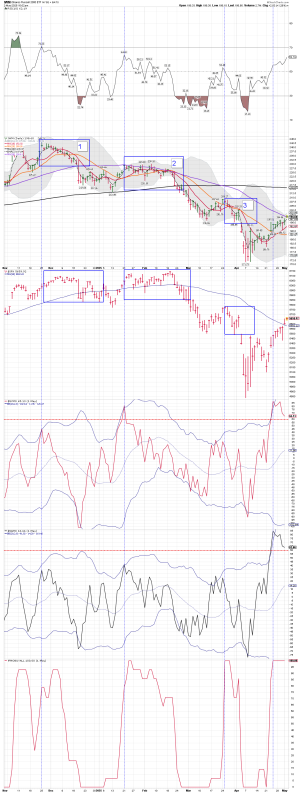
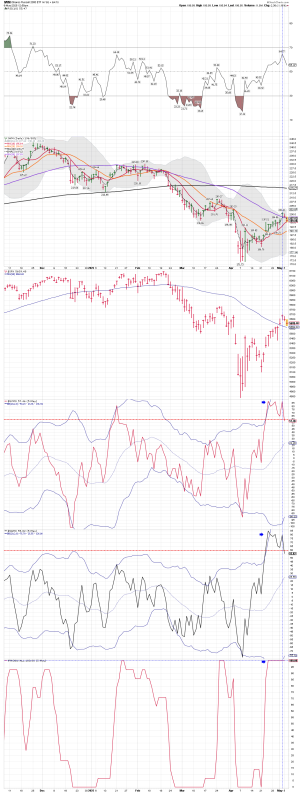
IWM daily chart as we move into the last hour of trading: The indicators, the 3 vertical lines on the IWM daily chart are warning us to reduce some.... We shall see how it plays out as BTDers continue to show up.
Bottom Line: The move up continues and so does the Risk levels.... I will point out the SPX does perform better after these warning signals are generated, but I trade small and Midcap most of the time.
Bottom Line: The move up continues and so does the Risk levels.... I will point out the SPX does perform better after these warning signals are generated, but I trade small and Midcap most of the time.
Attachments
Last edited:
robo
TSP Legend
- Reaction score
- 471
I don't know how this will play out, but the extremely oversold VXF has passed and now has made a very nice run higher. I'm trading using Bear Market rules so I'm flat again.Is it a bull trap or will more good news continue to fuel a rally higher?
Sent from my iPhone using Tapatalk
I just trade my indicators. When the indexes I'm trading are extremely oversold I usually go long, when they are extremely overbought I reduce. Currently the market is in area that I don't trade.
Bottom Line: The trend remains up for VXF and IWM. They are both getting closer to testing their 50 day SMAs.
Attachments
robo
TSP Legend
- Reaction score
- 471
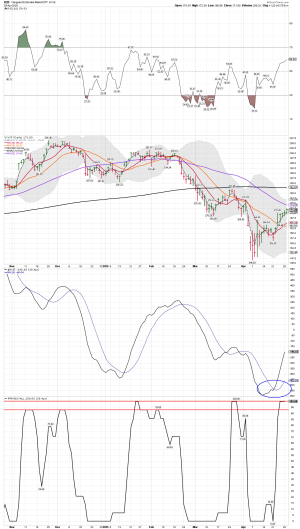
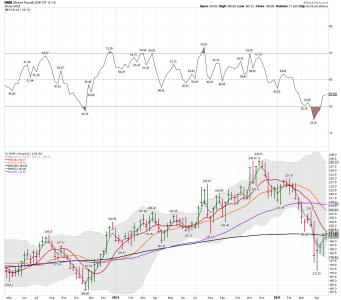
IWM daily: For now IWM continues to make lower highs.... The BTDers continue to come in, and it looks like that will continue.
My data indicates the current move lower is not complete.
IWM daily, weekly, monthly: For now IWM continues to make lower highs.... A nice bounce off the 10 day SMA, but IWM needs to move back above the 50 day SMA, and start a trending move higher.
My data indicates the current move lower is not complete.
IWM daily, weekly, monthly: For now IWM continues to make lower highs.... A nice bounce off the 10 day SMA, but IWM needs to move back above the 50 day SMA, and start a trending move higher.
Attachments
robo
TSP Legend
- Reaction score
- 471
I do not use this indicator for trading.
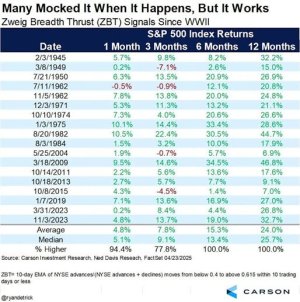
This Indicator Has a 100% Success Rate so Far…
BY MIKE BURNICK, CONTRIBUTING EDITOR, MARKET MINUTEThe drumbeat of doom in both the financial and popular press grew very loud since “liberation day.”
Market sentiment got so bearish that it was actually bullish.
By almost any measure you choose, stocks were extremely oversold. All that was needed next was for buyers to step up to the plate. And last week, buyers showed up in a very big way.
Attachments
robo
TSP Legend
- Reaction score
- 471

robo
TSP Legend
- Reaction score
- 471
IWM daily: Will this be a pattern 2? IWM is testing the 50 day SMA... We shall see how it plays out.... The indicators on my daily IWM chart say go to cash or short.... I choose to go with a Beer Money trade and short. It does look good for a close above the 50 day SMA as the BTDers are coming in again.
Beer Money Trade: Long RWM
For now I'm trading using Bear Market rules as IWM continues to make lower highs.
Beer Money Trade: Long RWM
For now I'm trading using Bear Market rules as IWM continues to make lower highs.
Attachments
Last edited:
robo
TSP Legend
- Reaction score
- 471
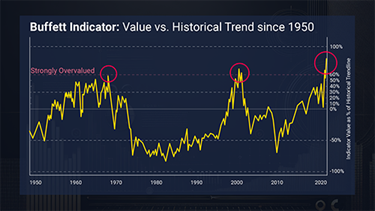
t’s known as the “Buffett Indicator.”
And it just hit 209% - its highest level ever in financial history.
Translation: stocks are more overvalued now than before the dot-com crash… the 2008 meltdown… and yes, more overvalued than even 1929.

 get.goldenportfolio.com
And it just hit 209% - its highest level ever in financial history.
Translation: stocks are more overvalued now than before the dot-com crash… the 2008 meltdown… and yes, more overvalued than even 1929.
GPIV_BuffettIndicator
Warren Buffett’s Favorite Indicator Is SignalingWhere Gold Is Headed Over The Next Decade… With A Track Record... Of 100% Accuracy! Get Four Top Miners With up to 100X Upside- Potential for the Coming “Buffett Gold Mania”
get.goldenportfolio.com
Attachments
robo
TSP Legend
- Reaction score
- 471
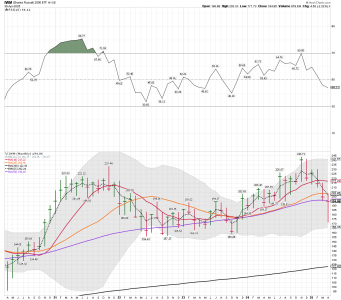
IWM monthly: We shall see if the Bulls can get the monthly trend back above the 3 month EMA this week. The goal is to get back the 10 month MA, and then a higher high..... We shall see how it plays out. May is starting out with a Bang, as the IWM monthly trend moved back above the 50 month SMA
Attachments
robo
TSP Legend
- Reaction score
- 471
IWM/SPX weekly: The ICL printed and the trend is up on the weekly charts. We shall see how it plays out, but the weekly charts looks Bullish, and the trend remains up. The SPX and IWM are now both back above their 10 week SMA. That's good news for the Bulls.
I still have a small RWM position based on the daily chart data. ( Second chart)
I still have a small RWM position based on the daily chart data. ( Second chart)
Attachments
Last edited:
robo
TSP Legend
- Reaction score
- 471
USD weekly: Unable to hold above the 3 weekly EMA. The USD remains the wildcard in my opinion along with the Treasury Market. What is the yearly interest on our 37T in debt, as some countries are not buying our US notes. We need to sell our notes to someone to keep the big spending party going.
Why the US Treasury Market is on the Brink of Total Collapse
Attachments
robo
TSP Legend
- Reaction score
- 471
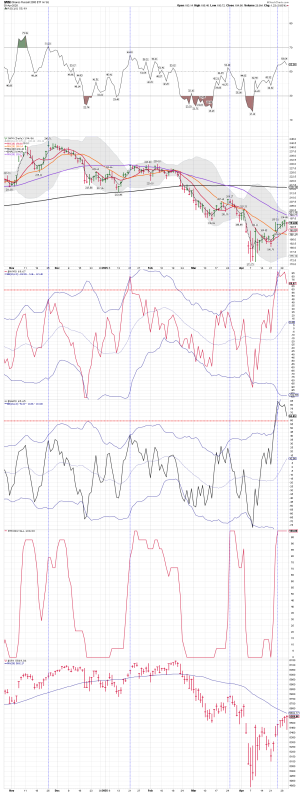
IWM/SPX daily: IWM is still finding resistance at the 50 day SMA. My daily chart indicates it is not the time to buy IWM again. I'm currently trading the daily charts, and they are still giving out warning indicators. Keep in mind I trade extremes in both directions. We shall see if the tariff talks can give IWM a nice move higher above the 50 day SMA this week. Canada is currently in the cue for tariff talks. China has reduced container shipments, so we shall see how that plays out. It's getting harder to believe the tariff comments coming out of the White House right now.
Attachments
Last edited:
robo
TSP Legend
- Reaction score
- 471