Not unexpectedly, the market spent a good deal of the trading day in negative territory, but like we've seen so many times in recent weeks it staged a modest comeback to end the day on a positive note. That's good news for the Seven Sentinels as it helps moderate whipsaw action. The less volatility we see, the better the system will perform.
Let's see how the charts fared today:
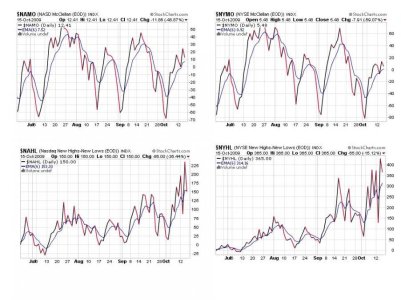
Modest deterioration of all four signals is evident today, but after the large gains yesterday that was to be expected. The good news is we didn't get a hard pullback, which could have spiked all four signals into a sell condition. If we could get more moderate pullbacks and consolidate gains in a more orderly fashion the system will provide a much better interpretation of the Intermediate Term Trend. So we only have one signal on a sell today in these four charts, and not by all that much.
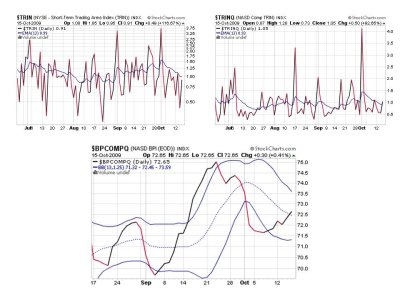
Some deterioration in TRIN and TRINQ is seen here, but again it's modest. Only one went to a sell condition and that wasn't by much either. BPCOMPQ however, actually got a little bit stronger. So only one sell signal in these charts means the system has 5 buys and 2 sells, which keeps the system on a buy.
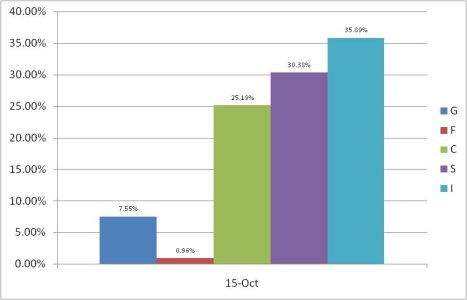
This is how our Top 25% were positioned for today's action. This is the most bullish position we've seen since I began compiling these charts. They collectively have a stock exposure over 91%.
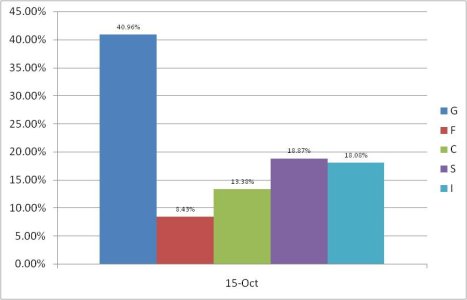
Here's something new I put together. This chart shows the collective position of everyone who's on the tracker. That's 197 folks. Total stock exposure is only 50.33% (Excluding L funds which are statistically meaningless as few participants own them). This means about half of the cash is out of the market. I have to wonder if this is in any way a general representation of the market in terms of cash on the sidelines. I cannot view this as bullish in terms of sentiment. I would view this as neutral for the broader market.
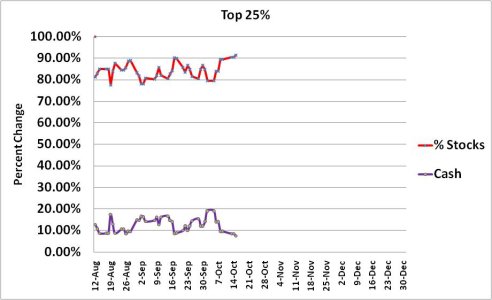
Back to our top 25% in this chart. As expected we can see stock exposure continuing to rise here.
Let's see how the charts fared today:

Modest deterioration of all four signals is evident today, but after the large gains yesterday that was to be expected. The good news is we didn't get a hard pullback, which could have spiked all four signals into a sell condition. If we could get more moderate pullbacks and consolidate gains in a more orderly fashion the system will provide a much better interpretation of the Intermediate Term Trend. So we only have one signal on a sell today in these four charts, and not by all that much.

Some deterioration in TRIN and TRINQ is seen here, but again it's modest. Only one went to a sell condition and that wasn't by much either. BPCOMPQ however, actually got a little bit stronger. So only one sell signal in these charts means the system has 5 buys and 2 sells, which keeps the system on a buy.

This is how our Top 25% were positioned for today's action. This is the most bullish position we've seen since I began compiling these charts. They collectively have a stock exposure over 91%.

Here's something new I put together. This chart shows the collective position of everyone who's on the tracker. That's 197 folks. Total stock exposure is only 50.33% (Excluding L funds which are statistically meaningless as few participants own them). This means about half of the cash is out of the market. I have to wonder if this is in any way a general representation of the market in terms of cash on the sidelines. I cannot view this as bullish in terms of sentiment. I would view this as neutral for the broader market.

Back to our top 25% in this chart. As expected we can see stock exposure continuing to rise here.
