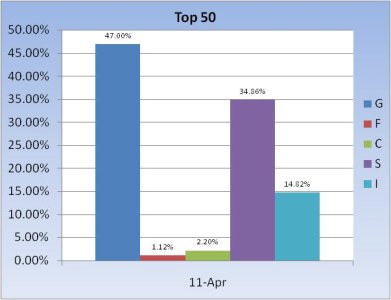
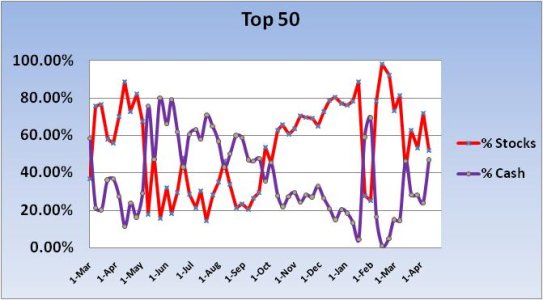
At first glance, the Top 50 look as though they have become much more defensive for the new trading week. We did have a bit of weakness late last week, but I didn't think it was enough to significantly affect the mix at the top. So I went back and took a look at how the Top 50 were spread out and I immediately knew why the chart looked more defensive. Number 51 on the tracker chart is the S fund. Right behind it at numbers 52-64 are folks fully invested in the S fund. We had just enough weakness last week to drop those folks out of the Top 50. Otherwise, the chart would be much more bullish. Let's take a look.


At the moment the Top 50 are collectively positioned with 47% of their holdings in the G fund. That's significant. And it's also true that 50% of the Top 10 are 100% G fund. Between spiking oil prices and the early indication that the Government might shutdown (our IFTs had to be in long before we knew the outcome), it would appear some risk management was in play.


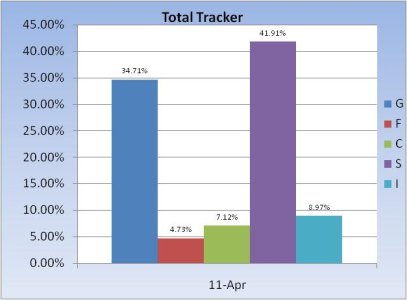
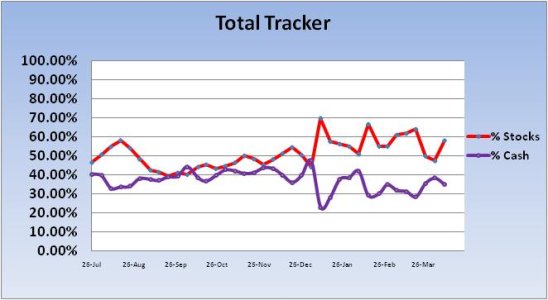
On the other hand, the Total Tracker shows that as a group we were buying the dip late last week. Plus our sentiment survey flipped back to a buy, so I think that helps explain the ramp up in stock allocations.
Futures are moderately higher as I write this, but that could change overnight. And while Congress bought some time Friday, we aren't out of the woods yet on that front. But then again the market didn't seem to have a major reaction to a potential shutdown, so maybe it's not as big a fear factor as it might seem.
Earnings season is upon us too, so we may see some volatility again if there are any surprises. And then there's spiking oil prices. That could be used as an excuse to drop the market back down again, but I'm not anticipating that scenario just yet. I'm looking for a breakout to the upside first.


At the moment the Top 50 are collectively positioned with 47% of their holdings in the G fund. That's significant. And it's also true that 50% of the Top 10 are 100% G fund. Between spiking oil prices and the early indication that the Government might shutdown (our IFTs had to be in long before we knew the outcome), it would appear some risk management was in play.


On the other hand, the Total Tracker shows that as a group we were buying the dip late last week. Plus our sentiment survey flipped back to a buy, so I think that helps explain the ramp up in stock allocations.
Futures are moderately higher as I write this, but that could change overnight. And while Congress bought some time Friday, we aren't out of the woods yet on that front. But then again the market didn't seem to have a major reaction to a potential shutdown, so maybe it's not as big a fear factor as it might seem.
Earnings season is upon us too, so we may see some volatility again if there are any surprises. And then there's spiking oil prices. That could be used as an excuse to drop the market back down again, but I'm not anticipating that scenario just yet. I'm looking for a breakout to the upside first.
