Thus far the 19-Feb 17-Session High/Low -10.46% Correction is ranked 207th of 10,902 putting this event in the bottom 1.9%
Will we go lower?
It should be noted this data represents lower prices (not lower closes).
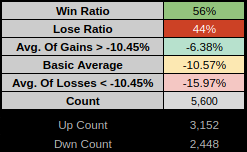
From 1983, we can filter 200 17-Session high/low events (100 better & 100 worse than -10.46%) and look out at 18-45 high/low sessions. For clarification, session 45 would be a measurement of the High from session 1 to the low from session 45. In this study we have 5,600 sessions, from this, 2,445 went lower than -10.46%
Roughly speaking this means "historically" we went lower than -10.46% ____ 44% of the time (from sessions 18-45). This is in the ballpark with general daily statistics which from 1983 have a daily win ratio of 54.6%.

From those 200 events
The majority were in Presidential Cycle Year 2, Quarter 3, and months Jan/Aug/Sep.

From those same 200 events, only one event was in Pres. Cyc. Yr-1, Q1, of March.
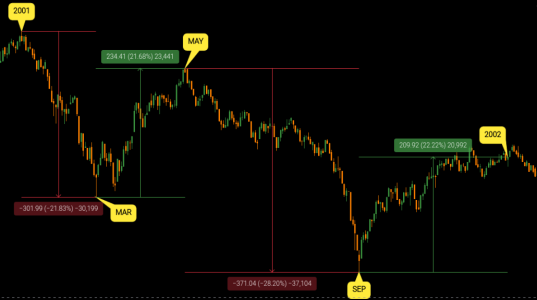
This was 2001 which lost -13.05% that year. As most folks here know that was a brutal time to be invested, the 2000-2002 Bear Market lost -49.1% and didn't fully recover until 2007 (just months before the great financial crisis).
The low in 2001 was on 21 September, but there was also a key low on 22 March.

From 1963 of the 24 years where March closed down YTD.
___The year closed positive 11 times with an average gain of 11.30%
___The year closed negative 13 times with an average loss of -15.63%
___Of the Top-10 Worst YTD March closes 6 closed positive for the year.
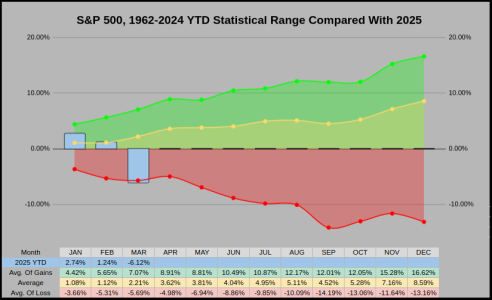
Here's where we currently stand within the past 63-years on the YTD spectrum.

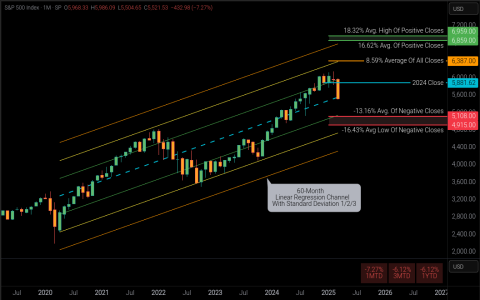
Same overall data, what's important here, within the 5-Year Linear Regression Channel (believe it or not) from this perspective we are "fairly priced" at the blue-dashed Linear Regression Line.

So will we go lower?
There are years when I do indulge myself in futile speculation, this isn't one of those years.
Have a great weekend....Jason
Will we go lower?
It should be noted this data represents lower prices (not lower closes).
From 1983, we can filter 200 17-Session high/low events (100 better & 100 worse than -10.46%) and look out at 18-45 high/low sessions. For clarification, session 45 would be a measurement of the High from session 1 to the low from session 45. In this study we have 5,600 sessions, from this, 2,445 went lower than -10.46%
Roughly speaking this means "historically" we went lower than -10.46% ____ 44% of the time (from sessions 18-45). This is in the ballpark with general daily statistics which from 1983 have a daily win ratio of 54.6%.

From those 200 events
The majority were in Presidential Cycle Year 2, Quarter 3, and months Jan/Aug/Sep.

From those same 200 events, only one event was in Pres. Cyc. Yr-1, Q1, of March.
This was 2001 which lost -13.05% that year. As most folks here know that was a brutal time to be invested, the 2000-2002 Bear Market lost -49.1% and didn't fully recover until 2007 (just months before the great financial crisis).
The low in 2001 was on 21 September, but there was also a key low on 22 March.

From 1963 of the 24 years where March closed down YTD.
___The year closed positive 11 times with an average gain of 11.30%
___The year closed negative 13 times with an average loss of -15.63%
___Of the Top-10 Worst YTD March closes 6 closed positive for the year.
Here's where we currently stand within the past 63-years on the YTD spectrum.

Same overall data, what's important here, within the 5-Year Linear Regression Channel (believe it or not) from this perspective we are "fairly priced" at the blue-dashed Linear Regression Line.

So will we go lower?
There are years when I do indulge myself in futile speculation, this isn't one of those years.
Have a great weekend....Jason
Last edited:
