In the February Blog, I stated "56% of the yearly lows fall within the 1st quarter".
This was looking at the location of yearly lows on the monthly time-frame.
Now I'll review the location of monthly lows on the daily time-frame.
An important distinction, this data references the monthly lows, not the monthly closing low.
During the previous 63-Years, (756 months) we have 15,891 trading sessions.
There are 759 monthly lows, (sometimes they occurred more than once within a month).
This data will look for correlations of the monthly low against the 23 trading days, Day of Week, Options Expiration, and the 10/20/50/200/500 moving averages.
Months vary in length, but we do have a full 16 trading days each month, and then it starts to taper off from trading day 17-23

As an example, this Feb-2025, the 1st trading day fell on a Monday and it also happens to be our current low for the month.

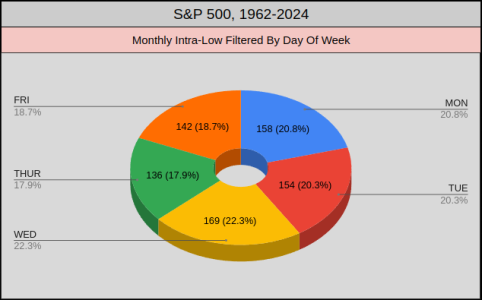
Across all 759 monthly lows and trading sessions 1-23, Wednesday had a slight edge at 22.3% while Thursday was least likely with 17.9%.

Data Disclaimer: This chart filters out the 3rd Friday of each month.
Most of the time this is our Options Expiration, but I happen to know I'm missing some rouge Thursdays.
"When a Friday lands on a holiday, then the expiration date is Thursday of the same week"
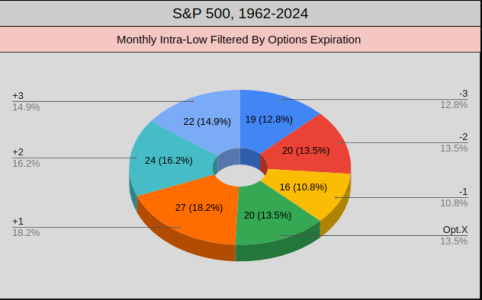
When I track Options Ex, I add 3 days before & after, so -3, -2, -1, OptX, +1, +2, +3, I call this the 7-Session Options Ex Window.
34.9% of monthly lows fall within the this 7-Session Options Ex Window, which ranges from trading days 8-18.

From this 7-Session Options Ex Window, the majority or 18.2% of monthly lows fall on +1 (the day after Options Ex).

Bear with me, we're almost done....
Data Disclaimer: If the monthly low & moving average are the same price, the data is not counted.
With each moving average we have up to 750 options to find the monthly low, thus with five moving average we have 3750 options.
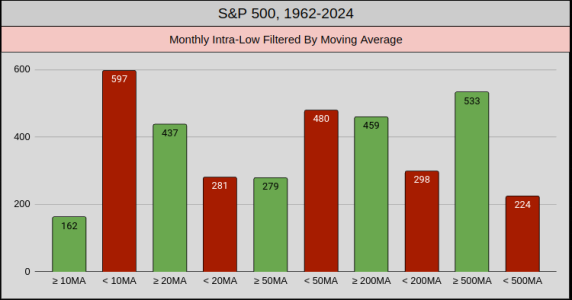
66% of monthly lows were a combination of: < 10-MA, > 20-MA, < 50-MA, > 200-MA, > 500-MA
Basically below the 10 & 50 but above the 20.
78.6% of monthly lows were found when the index closed below the 10-MA
60.8% of monthly lows were found when the index closed above the 20-MA
63.2% of monthly lows were found when the index closed below the 50-MA

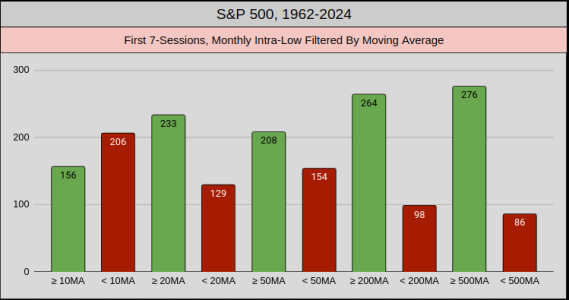
Since we already know 47.7% of the time, the monthly low is within the first 7 trading days of the month, we can look at the moving averages within this window. Again, 66% of monthly lows used the same combination of: < 10-MA, > 20-MA, < 50-MA, > 200-MA, > 500-MA
Within the 7-day window of 362 monthly lows:
56.9% of monthly lows were found when the index closed below the 10-MA
64.3% of monthly lows were found when the index closed above the 20-MA
57.4% of monthly lows were found when the index closed below the 50-MA

Using this data we could guess the probability that the first trading day 3-Feb-2025 was the monthly low. From those previous 63 years, 16.46% of monthly lows fell within these filters (the same as 3-feb-2025). It might not seem like much of an edge, but if we consider this February has 19 trading days, 1 of 19 is 5.26% so in theory we've tripled the probability....
If you made it this far, thanks for reading... Jason
This was looking at the location of yearly lows on the monthly time-frame.
Now I'll review the location of monthly lows on the daily time-frame.
An important distinction, this data references the monthly lows, not the monthly closing low.
During the previous 63-Years, (756 months) we have 15,891 trading sessions.
There are 759 monthly lows, (sometimes they occurred more than once within a month).
This data will look for correlations of the monthly low against the 23 trading days, Day of Week, Options Expiration, and the 10/20/50/200/500 moving averages.
Months vary in length, but we do have a full 16 trading days each month, and then it starts to taper off from trading day 17-23
22.4% of the time, the monthly low is on the first trading day of the month. Statistically speaking, all other trading days pale in comparison to day 1
From this 22.4%, the monthly win ratio was 99.8% with an average gain of 4.28%
47.7% of the time, the monthly low is within the first 7 trading days of the month.
From this 47.7% the monthly win ratio was 91.2% with an average gain of 3.44%
After the 7th trading day, the Monthly win ratio falls to 65% or below.
If a monthly low is made on or after the 16th day, the monthly win ratio is less than 23%

As an example, this Feb-2025, the 1st trading day fell on a Monday and it also happens to be our current low for the month.
On trading day 1, 49 of 170 monthly lows fell on a Monday, (more than any other day at 28.8%).
For trading days 1-7, 91 of 362 monthly lows fell on a Wednesday, (more than any other day at 25.1%).

Across all 759 monthly lows and trading sessions 1-23, Wednesday had a slight edge at 22.3% while Thursday was least likely with 17.9%.

Data Disclaimer: This chart filters out the 3rd Friday of each month.
Most of the time this is our Options Expiration, but I happen to know I'm missing some rouge Thursdays.
"When a Friday lands on a holiday, then the expiration date is Thursday of the same week"
When I track Options Ex, I add 3 days before & after, so -3, -2, -1, OptX, +1, +2, +3, I call this the 7-Session Options Ex Window.
34.9% of monthly lows fall within the this 7-Session Options Ex Window, which ranges from trading days 8-18.

From this 7-Session Options Ex Window, the majority or 18.2% of monthly lows fall on +1 (the day after Options Ex).

Bear with me, we're almost done....
Data Disclaimer: If the monthly low & moving average are the same price, the data is not counted.
With each moving average we have up to 750 options to find the monthly low, thus with five moving average we have 3750 options.
66% of monthly lows were a combination of: < 10-MA, > 20-MA, < 50-MA, > 200-MA, > 500-MA
Basically below the 10 & 50 but above the 20.
78.6% of monthly lows were found when the index closed below the 10-MA
60.8% of monthly lows were found when the index closed above the 20-MA
63.2% of monthly lows were found when the index closed below the 50-MA

Since we already know 47.7% of the time, the monthly low is within the first 7 trading days of the month, we can look at the moving averages within this window. Again, 66% of monthly lows used the same combination of: < 10-MA, > 20-MA, < 50-MA, > 200-MA, > 500-MA
Within the 7-day window of 362 monthly lows:
56.9% of monthly lows were found when the index closed below the 10-MA
64.3% of monthly lows were found when the index closed above the 20-MA
57.4% of monthly lows were found when the index closed below the 50-MA

Using this data we could guess the probability that the first trading day 3-Feb-2025 was the monthly low. From those previous 63 years, 16.46% of monthly lows fell within these filters (the same as 3-feb-2025). It might not seem like much of an edge, but if we consider this February has 19 trading days, 1 of 19 is 5.26% so in theory we've tripled the probability....
If you made it this far, thanks for reading... Jason
