Our sentiment survey issued another buy signal for next week. That makes the fifth week in a row. And who can argue with its success? It's only ranked #7 on tracker. 
But like any other system it's not perfect. Nothing ever will be (unless you're an insider at GS ). I've noted that each successive buy signal these past five weeks has seen an increase in bullishness. Here's the ratios starting with next week's ratio and going back five weeks:
1.50 -1
1.42 -1
1.24 -1
1.07 -1
0.64 -1
To get a sell signal we'd have to hit 2.00 - 1 in a bull market, so by that measure we have a ways to go yet. But as our bullishness has slowly crept up, our collective stock allocation has lagged. Quite a bit actually. So we may be voting bullish, but those votes don't seem to be translating in much stock fund buying as you'll see below in the Total Tracker charts.
But let's start with the Top 50.


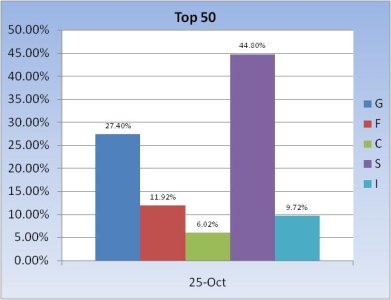
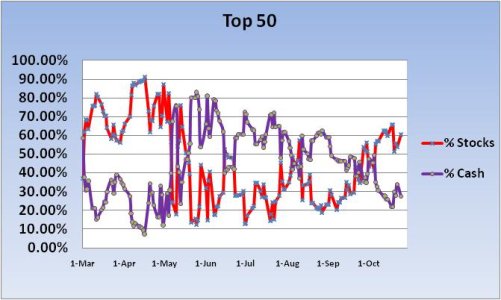
The Top 50 have have just over a 60% stock fund allocation this week. They've been holding relatively steady there for the past 2 weeks. It's a moderately aggressive stance in my view. And once again the S fund is the overwhelming choice of fund.


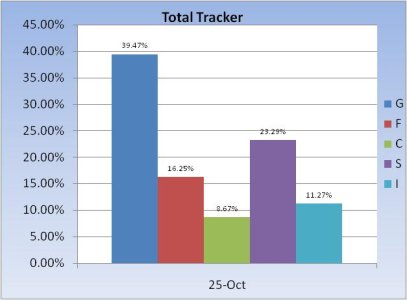
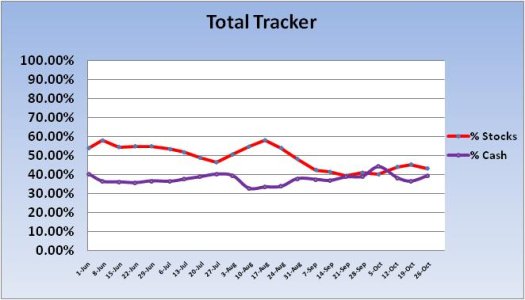
On other hand, the Total Tracker shows a much lower stock fund position at about 43%. They are holding more cash and bonds than the Top 50. Notice the dip in stock allocation this week in spite of the increased bullish ratio from our survey for this coming week. I'd say we are mildly bearish by this chart.
But what matters is the survey, and that's what most traders look at.
As I mentioned in yesterday's blog, I am now holding 45% stocks, 35% cash, and 20% bonds. I am actually neutral for this week, but I am raising cash now so I'm prepared to buy lower once November gets here. If we don't get that correction, then that 45% stock allocation will benefit my bottom line.
But like any other system it's not perfect. Nothing ever will be (unless you're an insider at GS
1.50 -1
1.42 -1
1.24 -1
1.07 -1
0.64 -1
To get a sell signal we'd have to hit 2.00 - 1 in a bull market, so by that measure we have a ways to go yet. But as our bullishness has slowly crept up, our collective stock allocation has lagged. Quite a bit actually. So we may be voting bullish, but those votes don't seem to be translating in much stock fund buying as you'll see below in the Total Tracker charts.
But let's start with the Top 50.


The Top 50 have have just over a 60% stock fund allocation this week. They've been holding relatively steady there for the past 2 weeks. It's a moderately aggressive stance in my view. And once again the S fund is the overwhelming choice of fund.


On other hand, the Total Tracker shows a much lower stock fund position at about 43%. They are holding more cash and bonds than the Top 50. Notice the dip in stock allocation this week in spite of the increased bullish ratio from our survey for this coming week. I'd say we are mildly bearish by this chart.
But what matters is the survey, and that's what most traders look at.
As I mentioned in yesterday's blog, I am now holding 45% stocks, 35% cash, and 20% bonds. I am actually neutral for this week, but I am raising cash now so I'm prepared to buy lower once November gets here. If we don't get that correction, then that 45% stock allocation will benefit my bottom line.


