Market character continues to be one of resilience. The weak seasonal cycle wasn't weak. And selling pressure has only seen the indexes fall just enough to trigger intermediate term sell signals and increase bearishness. Then it's been off to new highs. So far, we seem to be repeating that same scenario. Except this time, the S&P is showing much more resilience than the Wilshire. That implies that defensive plays are somewhat favored for the moment. And sentiment is remaining more bullish across various sentiment surveys, including our own, in spite of any weakness we've had of late. And then there's the dip buying on the auto-tracker, which saw its third increase in stock allocations in as many weeks. This all suggests that the bottom is not likely in.
Last week was another mixed week; with the C fund rising a respectable 0.6%, but the Wilshire 4500 and the I funds fell 0.29% and 1.21% respectively. That makes five of the last seven weeks that our three funds were mixed. I was looking lower and if wasn't for Friday's retrace of Thursday's losses, all the funds would have been down. Not much has changed going into the new week.
There were no auto-tracker signals and our sentiment survey came in with 55% bulls and 36% bears, which is modestly bearish. The AAII survey came in bearish again too, with 45.5% bulls and 21.5% bears. Other surveys are showing persistent bullishness as well. While liquidity does remain strong overall, those levels can be volatile. And we saw an example of that late in the week when Thursday’s action saw significant downside pressure, but retraced most of those losses the very next day.
Here's some charts:
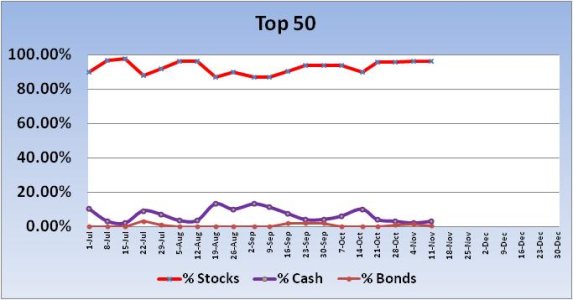
For the new trading week, total stock allocations for the Top 50 remained steady at 96.38%. This is a bullish reading for this group longer term (more than a week).
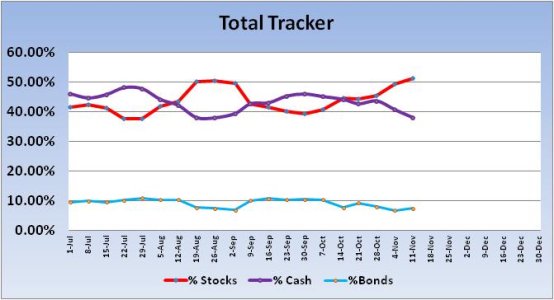
Stock allocations across the auto-tracker rose for the 5th week out of the last 6 by 1.88% to a total stock allocation of 51.29%.
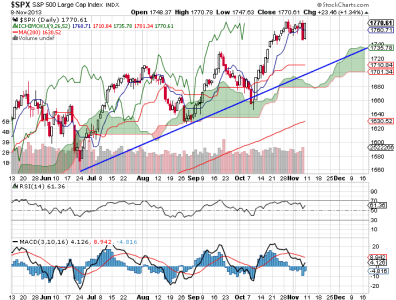
Of our three TSP stock funds, only the C fund (S&P 500) had an up week. And looking at the chart we can see price closed not far off its all-time highs. MACD is still positive, but has been losing upside momentum. RSI is slowly weakening, but also remains positive. The chart remains bullish.
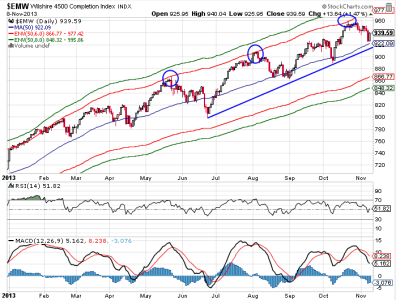
In contrast to the S&P 500, weakness continues for the Wilshire 4500 (Friday's rally notwithstanding). Momentum has continued to slide lower as has RSI. The 50 day moving average has been a good target area for support, and so far price has remained above that level. I’m willing to anticipate support at that moving average, but I’ll have to see how bearish sentiment gets at that point before I’d trust a potential reversal in that area. Just under that 50 dma is a rising trend support line. That may be a better target area for a potential reversal. Assuming a short term bottom is not in yet. And I'd not bet the farm on that trend support line should this index resume its downward push. This intermediate term cycle is a bit different this time around as I'd mentioned earlier. I really would like to see more bearishness before ramping up stock exposure.
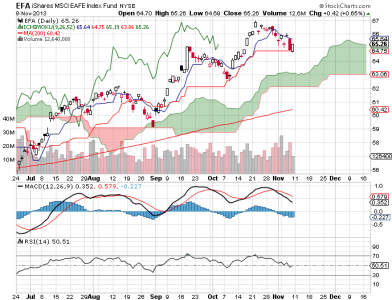
The EFA (similar to the I fund) still looks bullish overall as price remains above the cloud, but like the indexes, MACD and RSI are weakening. Support will be around the Leading Span A line, which is about 63 on the chart. The dollar has been rising of late too, and that's been helping to put a drag on price for this fund.
So to sum it up again, I am looking lower next week for the reasons I've cited above. If the Wishire gets below its 50 day moving average, I'll be looking to increase my stock exposure by about 20%. I'll add more if it continues to decline beyond that. It's tricky, because we've seen how quickly these indexes reverse off the bottom. Waiting for clear buy signals usually means missing 2-4% of the upside.
The market will be open Veterans' Day (THANK YOU FOR YOUR SERVICE). The Dow has been down 8 of the last 13 years on that holiday. Friday is OPEX. The Dow has been up 8 of the last 10 years on November expiration day. And as a look ahead, the Dow has been up 15 of the last 19 years the week before Thanksgiving.
To see this week's full analysis, follow this link http://www.tsptalk.com/members/
Last week was another mixed week; with the C fund rising a respectable 0.6%, but the Wilshire 4500 and the I funds fell 0.29% and 1.21% respectively. That makes five of the last seven weeks that our three funds were mixed. I was looking lower and if wasn't for Friday's retrace of Thursday's losses, all the funds would have been down. Not much has changed going into the new week.
There were no auto-tracker signals and our sentiment survey came in with 55% bulls and 36% bears, which is modestly bearish. The AAII survey came in bearish again too, with 45.5% bulls and 21.5% bears. Other surveys are showing persistent bullishness as well. While liquidity does remain strong overall, those levels can be volatile. And we saw an example of that late in the week when Thursday’s action saw significant downside pressure, but retraced most of those losses the very next day.
Here's some charts:

For the new trading week, total stock allocations for the Top 50 remained steady at 96.38%. This is a bullish reading for this group longer term (more than a week).

Stock allocations across the auto-tracker rose for the 5th week out of the last 6 by 1.88% to a total stock allocation of 51.29%.

Of our three TSP stock funds, only the C fund (S&P 500) had an up week. And looking at the chart we can see price closed not far off its all-time highs. MACD is still positive, but has been losing upside momentum. RSI is slowly weakening, but also remains positive. The chart remains bullish.

In contrast to the S&P 500, weakness continues for the Wilshire 4500 (Friday's rally notwithstanding). Momentum has continued to slide lower as has RSI. The 50 day moving average has been a good target area for support, and so far price has remained above that level. I’m willing to anticipate support at that moving average, but I’ll have to see how bearish sentiment gets at that point before I’d trust a potential reversal in that area. Just under that 50 dma is a rising trend support line. That may be a better target area for a potential reversal. Assuming a short term bottom is not in yet. And I'd not bet the farm on that trend support line should this index resume its downward push. This intermediate term cycle is a bit different this time around as I'd mentioned earlier. I really would like to see more bearishness before ramping up stock exposure.

The EFA (similar to the I fund) still looks bullish overall as price remains above the cloud, but like the indexes, MACD and RSI are weakening. Support will be around the Leading Span A line, which is about 63 on the chart. The dollar has been rising of late too, and that's been helping to put a drag on price for this fund.
So to sum it up again, I am looking lower next week for the reasons I've cited above. If the Wishire gets below its 50 day moving average, I'll be looking to increase my stock exposure by about 20%. I'll add more if it continues to decline beyond that. It's tricky, because we've seen how quickly these indexes reverse off the bottom. Waiting for clear buy signals usually means missing 2-4% of the upside.
The market will be open Veterans' Day (THANK YOU FOR YOUR SERVICE). The Dow has been down 8 of the last 13 years on that holiday. Friday is OPEX. The Dow has been up 8 of the last 10 years on November expiration day. And as a look ahead, the Dow has been up 15 of the last 19 years the week before Thanksgiving.
To see this week's full analysis, follow this link http://www.tsptalk.com/members/
