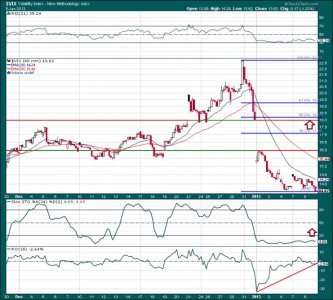
The VIX (Volatility Index) has been wandering around the 14-13 area for the last several days as viewed on the VIX sixty minute chart. But there is a gap window from 16 to 18 waiting to be filled. The fibonacci retracement tool shows a 50% retracement coming in around 18.2, which would fill the gap completely. There are gaps on many other charts as well, such as the SPX 500 E-mini futures and the 20 Year Treasury Bond Fund, that beckon. Notice too that the slow stochastic is quite oversold and the ROC is still below the center line, but appears to be forming a higher low. The RSI is not quite oversold at 35, but is not far away (from 30). So a minor shock of some kind may be around the corner. A new entry point may be realized as soon as the gaps are filled.


