Here are some updates from the previous charts I posted from the last blog.
AGG is riding along the ascending channel and has broken above the recent sideways trading action. In case you haven't noticed this is 6 up days in a row. While the air is thin up here, this could serve us well. There is no real history up above these levels, it's uncharted territory which could mean there isn't resistance to fight.

On the weekly charts the S&P 500 has thus far been rejected by the Oct 2007 peak trend-line. On the embedded 60 minute chart you can see the bounce off of the 1085 area. I would expect this area to be strong support based on the history here, but if it fails to hold take note because the next area of strong support will be around 1066.

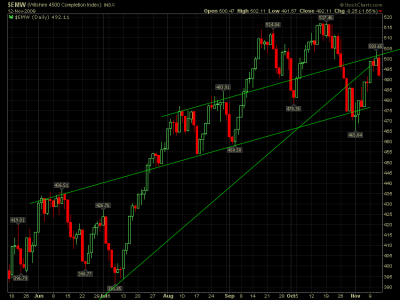
I bailed out $EMW earlier in the week due to my perceived weakness in the small caps. While the, NASDAQ 100, & S&P 500 made a higher high this week, many other charts haven't. In-fact, there are several potential Head & Shoulders in play throughout the markets. This has me on the defensive for now until I get confirmation of a direction.

The dollar... Let's start with the top chart $SPX:$USD shows us the slow stochastic has so far put in a lower peak and begun to turn over. If the dollar continues to climb then the stochastic will continue to fall.
The bottom chart shows the dollar bounced off its double bottom.

The Axial-Drifter long-term trender remains on a buy. Take care and have a great weekend...JTH
AGG is riding along the ascending channel and has broken above the recent sideways trading action. In case you haven't noticed this is 6 up days in a row. While the air is thin up here, this could serve us well. There is no real history up above these levels, it's uncharted territory which could mean there isn't resistance to fight.
On the weekly charts the S&P 500 has thus far been rejected by the Oct 2007 peak trend-line. On the embedded 60 minute chart you can see the bounce off of the 1085 area. I would expect this area to be strong support based on the history here, but if it fails to hold take note because the next area of strong support will be around 1066.
I bailed out $EMW earlier in the week due to my perceived weakness in the small caps. While the, NASDAQ 100, & S&P 500 made a higher high this week, many other charts haven't. In-fact, there are several potential Head & Shoulders in play throughout the markets. This has me on the defensive for now until I get confirmation of a direction.
The dollar... Let's start with the top chart $SPX:$USD shows us the slow stochastic has so far put in a lower peak and begun to turn over. If the dollar continues to climb then the stochastic will continue to fall.
The bottom chart shows the dollar bounced off its double bottom.
The Axial-Drifter long-term trender remains on a buy. Take care and have a great weekend...JTH