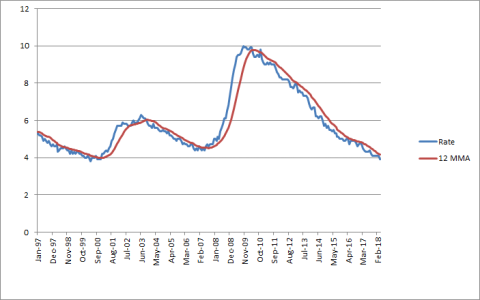
Oh my, Cactus I just rediscovered this thread for the first time in 2-1/2 years! I'd completely forgotten that you were tracking this, great job.
One comment, the signal to get out of stocks is two parts, first you look to see if the UE rate moves above the 12-month moving average, which it did today...that's step one...step 2 is to look at the trend of the S&P 500. If the month-end S&P 500 drops below the 10-month moving average (and I contacted the author of that article several years ago and he confirmed that he thinks it's best to use the month-end S&P 500 numbers, not intra-month daily numbers so you don't get whipsawed), then you have a confirmed sell signal. The month-end S&P 500 price fell below the 10-month moving average at the end of December, and was still below on 1/31/2019, so I'd say that step 2 is also satisfied and today we got a sell signal. Per my spreadsheet it's the first sell signal since the beginning of December 2007. I need to go back through your thread regarding revised UE rate numbers since I hadn't documented those...a month ago I had the UE rate moving average at 3.90%, a dead tie with the moving average, and wasn't sure how to handle that...but it appears you had the moving average at 3.89%...really splitting hair there but staying in the market for January sure made a huge difference!
Update - OK, now I see, the BLS numbers for some previous months changed here;
https://data.bls.gov/timeseries/LNS14000000 and when I plug in the changed numbers it looks to me like the sell signal actually came a month ago with the December report, since the 12-mo moving average was 3.892, and the December UE rate was above that at 3.9%.

