tsptalk's Market Talk

The early action sees the 10 year T-note yield down, the dollar is down slightly, and oil is down almost $7 so investors are weighing on the concern over the economy thins morning, rather than playing the inflation side.

Stocks were up early but flipped to the down as the morning choppiness plays out.

The CPI tomorrow is on most traders' minds as they jockey for position.
 
New highs for the dollar to start the day. Yields are up, oil is flat, and stocks are not happy.

The CPI came in hotter than expected again. Looking back at the June reaction to the CPI, stocks bottomed about a week after it was released.
 
The 2/10 year yield curve is now -0.13. That's now the most it has been inverted since the financial crisis.

071322b.gif
 
The close is key, but the early intraday action shows a breakdown in the bear flags on the C and S funds, while the I-fund is flirting with new lows.

071322c.gif
 
It means shorter term bonds (2-year) are paying more than the longer term (10-year), which is an odd situation and generally means there is something wrong with the economy. Historically it has preceded a recessions by several months to up to 2 years.

We had the inversions in 2006, 2007, a year before the financial crisis was apparent. Then again in October 2019 before the 2020 Covid crash / recession.

Here it is again, leading to... something.

071322d.gif


Hope that makes sense.


The 2/10 year yield curve is now -0.13. That's now the most it has been inverted since the financial crisis.

071322b.gif
 
JP Morgan earnings and a stronger than expected PPI report are setting the tone this morning.

JPM has been forming a slanted head and shoulders pattern before today's 4% breakdown.

071422a.gif


The dollar is making more new highs. Why the dollar is strong and metals are weak in this inflationary environment has been interesting. Gold has been a hedge against inflation forever.
 
This is options expiration week so the action can't always be trusted. That doesn't tell us much because we don't know if that means we can't trust the selling, or this afternoon's rebound. :rolleyes:

Seasonality-wise, the week after expiration week is a little more bearish than pre-expiration, but earnings may influence that this month.
 
The market seemed like it was ready for an excuse to rally and the retail sales report and some solid earnings reported by Citigroup may have done the trick as we see the indices flying this morning.

Lots of headwinds but we had some very dreary data recently yet the indices did not make new lows, so something was building.

This is a bear market however, and rallies may not last long with resistance all over the charts.
 
NYSE volume 6 to 1 advancers over decliners with 45 minutes left.

Nasdaq volume is about 2.5 to 1 Adv over Dec.
 
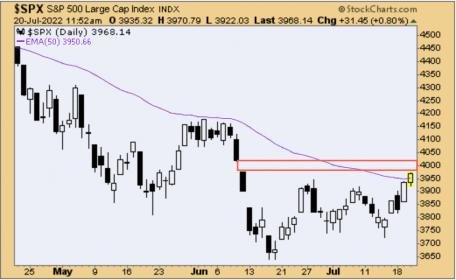
The bear flag is still in play and technically this rally could go up and hit the 50-dy EMA or even fill the June 10 open gap, and still have the flag be valid. Here's some potential "perfect" target areas.

071822a.gif
 
No share prices posted on tsp.gov for Monday yet. This is a first [that it has been delayed into the next business day] and TSP participants are not feeling a warm and fuzzy about this new website. I have some things to do after the TSP deadline today so hopefully the TSP will post yesterday's share prices before I go so I can update the site and Autotracker before I leave.

As for the market, we have big gap up at the open just to mess with us again. yesterday started out the same way and we saw how that went, so buckle up, the end of this month could get wild. Will we see 4017 on the S&P where the open gap is? Or will the 50-day EMA continue to hold as resistance? Will the bear flag break down, as they tend to do, or has the worst case scenario already been priced in?

Monday's closing chart:

071922a.gif
 
After a slow start, stocks are tacking onto Tuesday's gains with a morning rally. The 50-day EMA's are getting tested and so far they have been broken, but they are in the neighborhood.

072022a.gif


Bonds and the dollar are up, as is the HYG high yield corporate bonds.
 
The index is above the 50-day EMA, but will the bottom of the open gap hold as resistance? We talk about how gaps tend to get filled but every now and then we see these as a mental block on investors.


e6203901-bdcd-4696-95de-719be5781460
 

Attachments

  • SPX720.jpg
    SPX720.jpg
    20.6 KB · Views: 136
Yeah, good call. That happened in June as well where the first attempt to get into the gap failed, but it did later fill it about a week or so later.

072022d.gif
 
The futures were chopping back and forth between gains and losses all night, and that seems to have crept into the opening session in the first 30 minutes of trading.

The weekly jobless claims were a little higher than estimates and the highest since last November, but this is the Fed's mission - to slow down the economy and the job market to ease inflation.

Stocks are mixed as tesla is helping the Nasdaq to outperform this morning, while the S&P and small caps are down modestly as of 10 AM ET.

Bonds are up, oil is down $3.50, gold is up slightly, and bitcoin is giving back some of its recent gains.
 
Right after the opening bell we see stocks flat to higher with the EFA leading on the upside despite despite no move in the dollar yet. Oil is flat as well, gold is up, and bitcoin is up slightly.

There's a lot at stake next week so the action may be tentative, although tell that to the bond market as yields broke down and BND gapped up sharply. We could see that gaps try to get filled before the day is done.

072222a.gif


The yield curve is still inverted with both the 2 and 10 year yields moving lower today.

072222c.gif
 
Back
Top