tsptalk's Market Talk

I have a pets.com stuffed dog I bought way back then as a joke. I still have it and also the Taco Bell stuffed talking dog. Wonder if it will be worth a lot of money some day? Maybe I can go on Pawn Stars. ��
 
Bull flag breakout in bonds?

121120c.gif
 
Bull flag breakout in bonds?

Definitely something to watch. Todays' bond rates would still be at all time lows if yields went up 100%. Not saying we're heading for 5% mortgages again any time soon, but small percent increase would make sense.
 
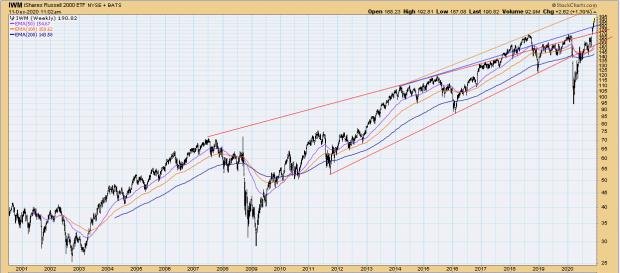
I am new to charting and to start learning I've had a StockCharts account for a couple of months now. I am fascinated by trendlines and the patterns they reveal. I was trying to recreate your first IWM chart's trendlines Tom when I noticed that all of my charts were on the log scale by default. I didn't notice it because I haven't been looking back 20 years. So I made a linear long-term IWM chart and saved it separately from my original log IWM chart. That begs the question: do you typically plot linear or log charts in your commentaries? Do you have a preference?

For the other newbies in the audience, I found a brief article explaining the differences here:

https://www.stockcharts.com/article...tween-a-logarithmic-and-arithmetic-chart.html

Thanks for bringing this to my attention Tom!

Sent from my moto x4 using Tapatalk
 
I look at it similarly to EMA vs. SMA moving averages. They can be self fulfilling and it depends what is working at the moment. If it looks like trendlines are only working (holding) on a chart that uses log scale, then go with that (for now). If the linear chart trendlines are working, use that until it stops.

But as you mention, linear vs. log scale is more meaningful on longer term charts. I almost always use linear on the short-term 3 - 4 month charts, but there wouldn't be much difference between the two.
 
They're killing the dollar, which of course raises prices. Stocks, bitcoin, housing, etc., without any "solid" fundamental reason for them going up except for the weak dollar. Gold is surprising not going up as much, which is interesting given that it tends to go up when inflation concerns hit.

121520a.gif


Stocks up today, for what - the 80th time - on more stimulus hopes. Spending more of our tax money that doesn't really exist yet. Killing the dollar. How often can stocks rally on the same rumor?
 
Agree! The most worrisome is housing, I still have memories of 2008. The ripple effect of any housing market downturn will once again be extraordinary. People are paying 3-4x more per square foot than what we bought for in the same neighborhood 15 years ago. The buyers today aren't getting a good deal as the mania has swept so many up.

I think bitcoin is just a "Robinhood" thing as not many have more than a trifling sum invested there. Having 5% of your investments in it won't make much difference in the long and those who brag to be millionaires on twitter have no concept of what risk really is. Luckily most of us saved appropriately over the years and don't have to try to shoot the moon on a wild speculation of digits on a hard drive.

The likely response is Fed hedges their answer as to when QE Infinity ends. They could say, "we're going to ease until the pandemic is over." That can be tomorrow or... really infinity.

If they come out and say we're going to increase purchases but only until June 2021, then the market could throw a tantrum.

Either way, the bugs kept saying the dollar collapse would help gold. It hasn't, so maybe inflation isn't as big a problem as some think.
 
A little gap filling by the dollar adding to the pressure on stocks today, but there's still a lot of resistance near the top of that gap.

121820a.gif
 
The dollar was popping up some today, and "may" be breaking the downtrend - too early to say. I suppose this will depend on how contained this "new strain" is to European countries.

122120a.gif
 
As the indices get closer to break even for the day, the hard part begins. Traders who were caught in the downdraft become relieved that they recouped those big morning losses and could start selling again.

Of course that's in a normal market environment. This recent rush to get in stocks in late 2020 may make this a different situation, but just pointing out that if this bounce is going to run out of steam today, it may be here near break even. I hope I'm wrong.
 
You and BM noted the basing in HYG a few weeks ago and that pattern appears to still be in play.

How much of today is due to the S&P re-balancing plus year end institutional re-balancing? If markets finish flat or close to, I'd say that's a very good reason. No doubt there are dip buyers out there though.
 
Back
Top