Our last buy signal on the Seven Sentinels was on September 4th. We've had a great run since that buy signal was issued. However, the past two trading days are showing some deterioration in market internals. That may mean more weakness is on its way or it could simply mean the market is taking a breather. We'll know soon enough next week.
There are no indications that this rally is over, but we may be seeing another tradeable sell signal beginning to develop. Since the March low, none of the Seven Sentinel sell signals have translated into significant selling pressure, but a couple of them have been good for a few extra percentage points in gains. I can only hope that if a sell signal develops, we don't get another buy signal before October 1st. Chances are we won't, but we did see a very quick reversal a few months ago where a sell signal was followed by a buy signal 3 days later. That’s a very unusual occurrence for the Seven Sentinels. We need to recognize that in our current market environment sentiment can change rapidly with an equally rapid shift in market positioning. This is causing the volatility we are seeing in the Seven Sentinels. But for the most part we’ve been able to play this volatility.
But I can’t worry about when these signals will occur. I can only play them as they happen and hope they occur within our IFT window. Right now there are only 8 trading days until October 1st, so we aren’t too far away from two new IFTs.
So let’s take a look at the big picture.

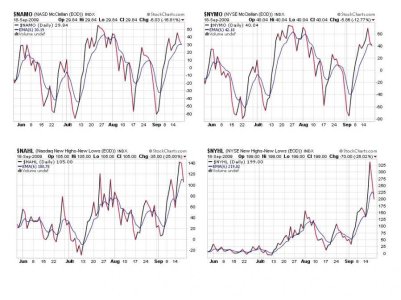
Even though we had a very modest rally Friday, these four indicators deteriorated a little more. They are now all flashing sell signals.

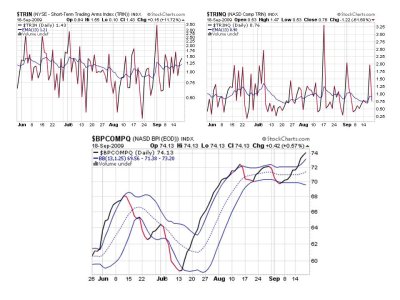
TRIN is also flashing a sell, but TRINQ and BPCOMPQ are still on a buy. This could change quickly without more support soon. This is why I have to watch these signals very carefully at this point.

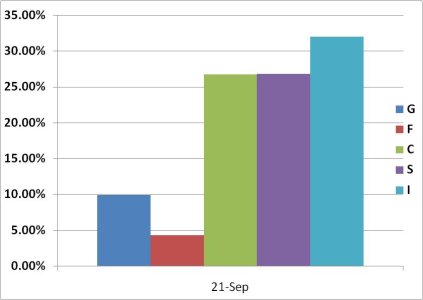
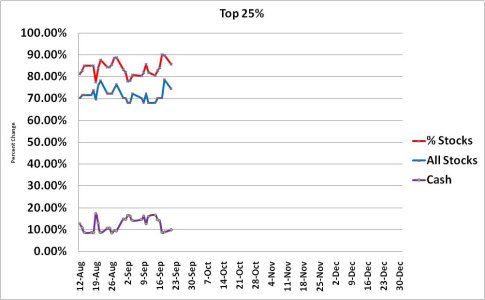
Not much change among our top 25%, but a little bit of cash was raised and bonds rose a little bit too. These percentages are still within a fairly tight range from the past few weeks and really show no signs of caution from our top performers.

Same info, different look.
So I'm still long, but watching intently. While we may get a Seven Sentinels sell signal soon, I do not expect a deep pullback. Our top 25% shows no inclination to reduce risk and the uptrend is still intact.
There are no indications that this rally is over, but we may be seeing another tradeable sell signal beginning to develop. Since the March low, none of the Seven Sentinel sell signals have translated into significant selling pressure, but a couple of them have been good for a few extra percentage points in gains. I can only hope that if a sell signal develops, we don't get another buy signal before October 1st. Chances are we won't, but we did see a very quick reversal a few months ago where a sell signal was followed by a buy signal 3 days later. That’s a very unusual occurrence for the Seven Sentinels. We need to recognize that in our current market environment sentiment can change rapidly with an equally rapid shift in market positioning. This is causing the volatility we are seeing in the Seven Sentinels. But for the most part we’ve been able to play this volatility.
But I can’t worry about when these signals will occur. I can only play them as they happen and hope they occur within our IFT window. Right now there are only 8 trading days until October 1st, so we aren’t too far away from two new IFTs.
So let’s take a look at the big picture.

Even though we had a very modest rally Friday, these four indicators deteriorated a little more. They are now all flashing sell signals.

TRIN is also flashing a sell, but TRINQ and BPCOMPQ are still on a buy. This could change quickly without more support soon. This is why I have to watch these signals very carefully at this point.

Not much change among our top 25%, but a little bit of cash was raised and bonds rose a little bit too. These percentages are still within a fairly tight range from the past few weeks and really show no signs of caution from our top performers.

Same info, different look.
So I'm still long, but watching intently. While we may get a Seven Sentinels sell signal soon, I do not expect a deep pullback. Our top 25% shows no inclination to reduce risk and the uptrend is still intact.
