Where The Money Is Made & Lost: The Four Quarters
Part 1: Where The Money Is Made & Lost
Part 2: Presidential Cycles
Part 3: The Four Quarters
Part 4: The Twelve Months
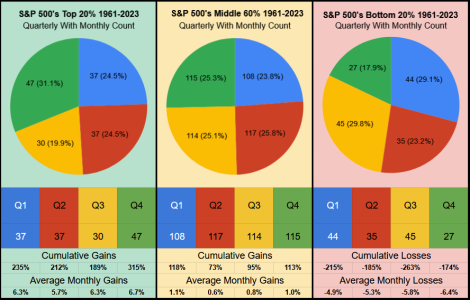
Here’s the Top 20%, Middle 60% & Bottom 20% of months sorted into the the four quarters.
Truncated: Historically, Q4 performs the best, with Q1 & Q4 performing best in the middle. For the worst, Q3 has the highest monthly count, and generally was the weakest performer across all three charts.
For the Top 20%, not surprisingly, 31% (47 of the best 151 months) fall within the 4th quarter.
Across the Middle 60% the 454 monthly count is distributed rather evenly but 57% of the cumulative gains were in Q1/2.
For the Bottom 20% Q1/3 have the highest monthly count, together they consume 59% of the pie. But on a cumulative basis, Q3 with a -263% accounts for a 31% share of the total losses.
It’s noteworthy, Q3 has the smallest monthly count of the Top 20%, the 2nd smallest monthly count of the Middle 60%, and the highest monthly count of the Bottom 20%.

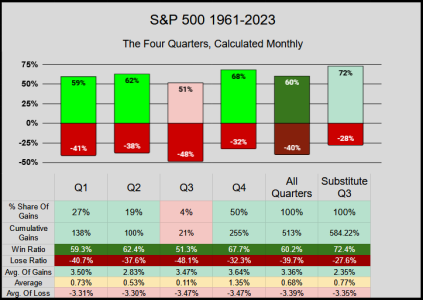
The key takeaway: In the chart below, column III shows a 4% share of all cumulative gains were earned in Q3. In contrast Column IV shows 50% of those cumulative gains were earned in Q4. So in theory we can get 96% of those returns with just 3 quarters.
Perhaps it's plausible: If we take risk off during Q3 by substituting with Nominal Interest Rates (based on data from SSA.Gov) our Q3 monthly average jumps from .11% to .49% with 91.75% cumulative gains. This increases our total 756-month cumulative gains from 513% to 584%, thus Q3’s share of gains jump from 4% to 16%, increasing our 63-Year average return from 8.14% to 9.27%

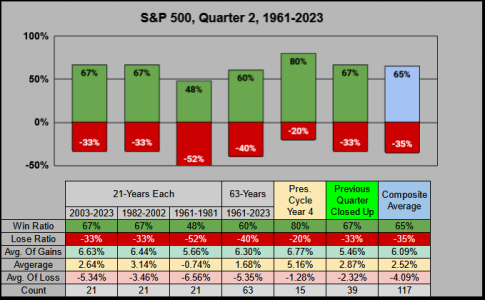
Bonus: I didn't post a Quarter 2 Blog, so here’s a summary. Although Q2 has the lowest quarterly win ratio at 60%, we do have some minor tail winds. Both Presidential Cycle Year 4 & our previous Q1 closing positive, boost our composite win ratio to 65% which increases our average gains to 2.52%

Part 1: Where The Money Is Made & Lost
Part 2: Presidential Cycles
Part 3: The Four Quarters
Part 4: The Twelve Months
Here’s the Top 20%, Middle 60% & Bottom 20% of months sorted into the the four quarters.
Truncated: Historically, Q4 performs the best, with Q1 & Q4 performing best in the middle. For the worst, Q3 has the highest monthly count, and generally was the weakest performer across all three charts.
For the Top 20%, not surprisingly, 31% (47 of the best 151 months) fall within the 4th quarter.
Across the Middle 60% the 454 monthly count is distributed rather evenly but 57% of the cumulative gains were in Q1/2.
For the Bottom 20% Q1/3 have the highest monthly count, together they consume 59% of the pie. But on a cumulative basis, Q3 with a -263% accounts for a 31% share of the total losses.
It’s noteworthy, Q3 has the smallest monthly count of the Top 20%, the 2nd smallest monthly count of the Middle 60%, and the highest monthly count of the Bottom 20%.

The key takeaway: In the chart below, column III shows a 4% share of all cumulative gains were earned in Q3. In contrast Column IV shows 50% of those cumulative gains were earned in Q4. So in theory we can get 96% of those returns with just 3 quarters.
Perhaps it's plausible: If we take risk off during Q3 by substituting with Nominal Interest Rates (based on data from SSA.Gov) our Q3 monthly average jumps from .11% to .49% with 91.75% cumulative gains. This increases our total 756-month cumulative gains from 513% to 584%, thus Q3’s share of gains jump from 4% to 16%, increasing our 63-Year average return from 8.14% to 9.27%

Bonus: I didn't post a Quarter 2 Blog, so here’s a summary. Although Q2 has the lowest quarterly win ratio at 60%, we do have some minor tail winds. Both Presidential Cycle Year 4 & our previous Q1 closing positive, boost our composite win ratio to 65% which increases our average gains to 2.52%

