Last week saw four negative closes in a row (Monday-Thursday) with Thursday's action pushing many longer term trading systems to the brink of sell conditions. But then Friday saw a hard reversal (it may turn out to be an oversold bounce), which erased most of the losses since Monday. Our sentiment survey for last week was bullish, but it wasn't much help given the action last week, and that's kind of how it's been for those trying to use the survey as a positioning tool for a awhile now.
This week? We've backed off last week's decidedly (week over week) bullish positioning by raising bond levels again. Here's the charts:


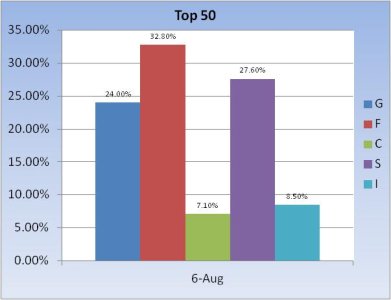
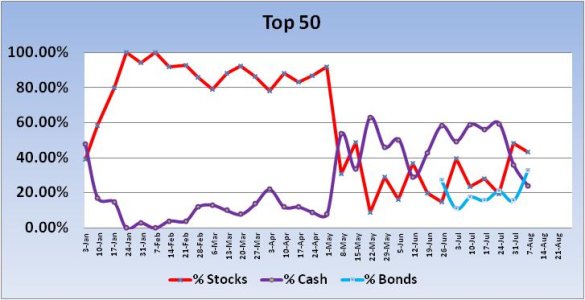
As you can see, the Top 50 significantly added to bond positions, increasing their collective exposure by almost double to 32.8%. Cash levels dropped by about 12% to a total of 24%, while stock exposure fell a more modest 5.1% to a total collective stock allocation of 43.2%.


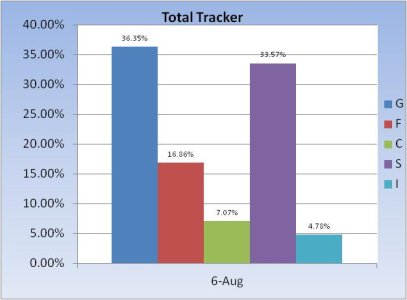
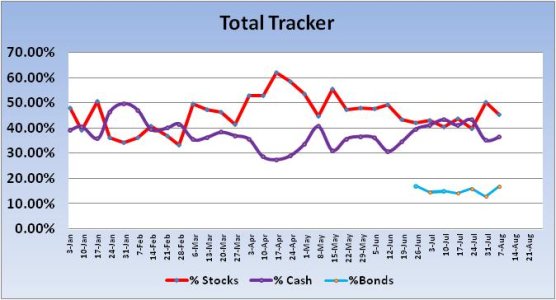
The Total Tracker didn't see nearly the increase in bond levels that the Top 50 did as this group ramped up bond exposure by a more modest 4.08% to total of 16.86%. Cash levels were only up about 1%, while stock exposure fell 4.92% to a total exposure of 45.42.%.
So we remain on the conservative side (decidedly so for the Top 50).
Our sentiment survey remained on a buy going into the new week (surprise, surprise). I'm looking for continued volatility ahead that will make for challenging positioning in TSP accounts.
This week? We've backed off last week's decidedly (week over week) bullish positioning by raising bond levels again. Here's the charts:


As you can see, the Top 50 significantly added to bond positions, increasing their collective exposure by almost double to 32.8%. Cash levels dropped by about 12% to a total of 24%, while stock exposure fell a more modest 5.1% to a total collective stock allocation of 43.2%.


The Total Tracker didn't see nearly the increase in bond levels that the Top 50 did as this group ramped up bond exposure by a more modest 4.08% to total of 16.86%. Cash levels were only up about 1%, while stock exposure fell 4.92% to a total exposure of 45.42.%.
So we remain on the conservative side (decidedly so for the Top 50).
Our sentiment survey remained on a buy going into the new week (surprise, surprise). I'm looking for continued volatility ahead that will make for challenging positioning in TSP accounts.
