According to the Relative Strength Index (RSI), the Wishire 4500 has been overbought since 2 January. That strength is overwhelming any attempts to take prices lower. Eventually, that strength will fall off. And with the Wilshire at all-time highs, once strength falters, the downside could be fast and deep. So if you're a bull, enjoy it while you can. I don't know how long it will last, but it's certainly been an impressive start to the new year.
Here's this week's charts:
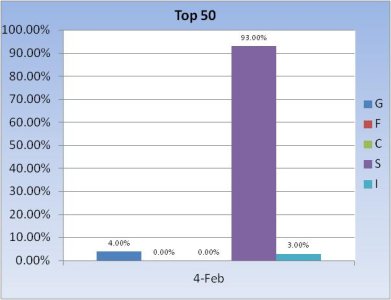
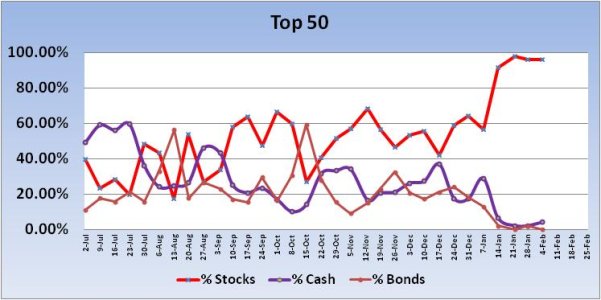
The Top 50 remained almost unchanged since last week.
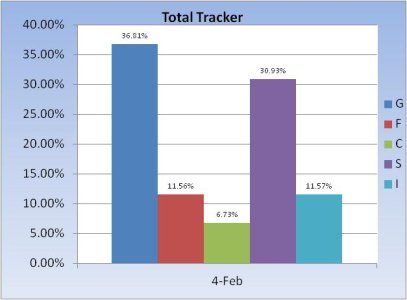
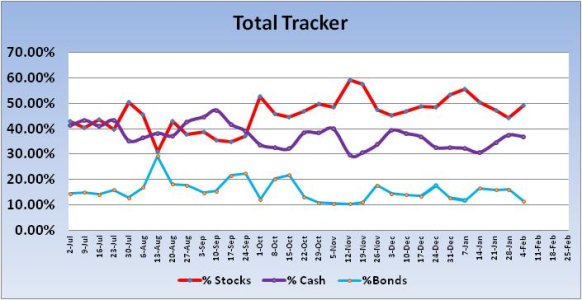
The Total Tracker showed an increase in stock allocations of 5.09%, from 44.14% to 49.23%.
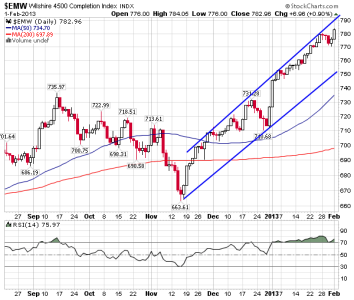
Looking at the Wilshire this week, you can see price remains in the upper end of the trading channel. And RSI moved higher at the end of last week after some "token" weakness. Negative divergences in other indicators aside, it appears price is likely to track higher under current conditions.
Here's this week's charts:


The Top 50 remained almost unchanged since last week.


The Total Tracker showed an increase in stock allocations of 5.09%, from 44.14% to 49.23%.

Looking at the Wilshire this week, you can see price remains in the upper end of the trading channel. And RSI moved higher at the end of last week after some "token" weakness. Negative divergences in other indicators aside, it appears price is likely to track higher under current conditions.
