Greetings
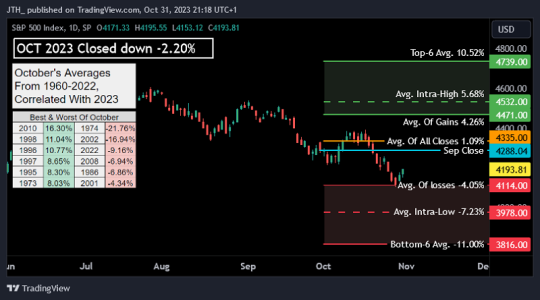
We finished October down -2.20%. From the 64 Months of October, this ranked as 13th worst. This is also the first time we've closed down 3 consecutive months since the pandemic low of Mar-2020. Additionally this is October’s 5th worst 3-Month performance at -8.61%.
From the chart below, our MTD high was 2.07% while our MTD low was -3.98%
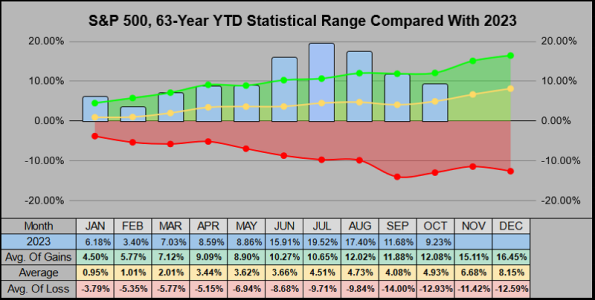
While we have closed the last 3 months down, we are still up 9.23% YTD. This is higher than the 4.93% YTD October average and higher than the 8.15% average for how the year closes out in December.
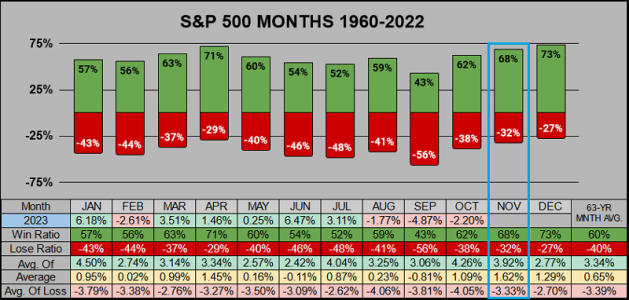
Looking ahead into November: We’ll have 21 trading days, with a Holiday on Thursday the 23rd, followed by a half-day on Black Friday.
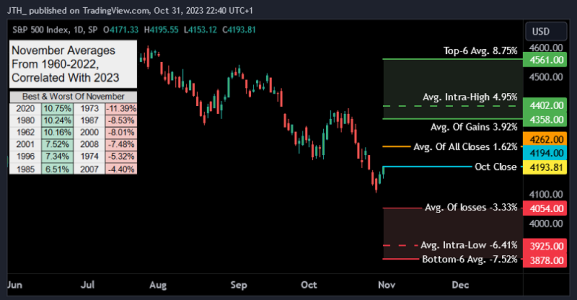
Historically November has the 3rd best win ratio at 68%, the 4th best average-of-gains at 3.92%, the best total average at 1.62%, and the 7th worst average-of-loses at -3.33%. Seasonally speaking November & December are the best 2-Month combo. Of the 8.15% YTD average gain, 3.22% (or 40%) of this gain is earned in the last 2 months.
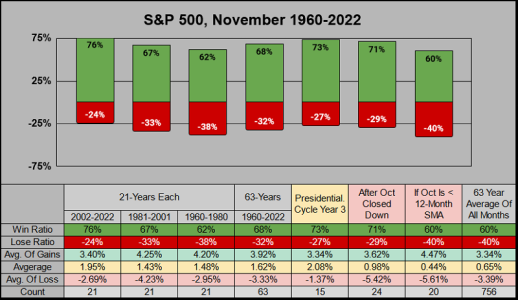
Digging down further into November, The chart below shows the most recent 21-years have a 76% win ratio. The lowest win ratio category is 60% from the 20 times October closed below the 12-Month SMA.
For November’s historical closing range, buyers may want to step in at 4054 while sellers may want to exit at 4358.
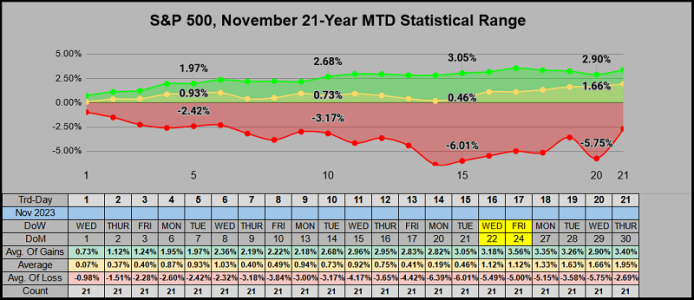
As we progress through the month on the MTD timeframe it looks like trading days 14-17 are the peak and trough of the month.
From the previous September Blog I had posted when September closed down hard, October was generally much better (that didn’t work). When seasonality works it’s great, when it doesn’t work it might be a red flag warning…
To leave on a positive note, from the past 63 years, Aug-Sep-Oct closed down consecutively 3 times. The next 3 Novembers all closed up for an average of 4.04%
Thanks for reading, have a great month!
We finished October down -2.20%. From the 64 Months of October, this ranked as 13th worst. This is also the first time we've closed down 3 consecutive months since the pandemic low of Mar-2020. Additionally this is October’s 5th worst 3-Month performance at -8.61%.
From the chart below, our MTD high was 2.07% while our MTD low was -3.98%

While we have closed the last 3 months down, we are still up 9.23% YTD. This is higher than the 4.93% YTD October average and higher than the 8.15% average for how the year closes out in December.

Looking ahead into November: We’ll have 21 trading days, with a Holiday on Thursday the 23rd, followed by a half-day on Black Friday.
Historically November has the 3rd best win ratio at 68%, the 4th best average-of-gains at 3.92%, the best total average at 1.62%, and the 7th worst average-of-loses at -3.33%. Seasonally speaking November & December are the best 2-Month combo. Of the 8.15% YTD average gain, 3.22% (or 40%) of this gain is earned in the last 2 months.

Digging down further into November, The chart below shows the most recent 21-years have a 76% win ratio. The lowest win ratio category is 60% from the 20 times October closed below the 12-Month SMA.

For November’s historical closing range, buyers may want to step in at 4054 while sellers may want to exit at 4358.

As we progress through the month on the MTD timeframe it looks like trading days 14-17 are the peak and trough of the month.

From the previous September Blog I had posted when September closed down hard, October was generally much better (that didn’t work). When seasonality works it’s great, when it doesn’t work it might be a red flag warning…
To leave on a positive note, from the past 63 years, Aug-Sep-Oct closed down consecutively 3 times. The next 3 Novembers all closed up for an average of 4.04%
Thanks for reading, have a great month!
