wavecoder
TSP Pro
- Reaction score
- 24
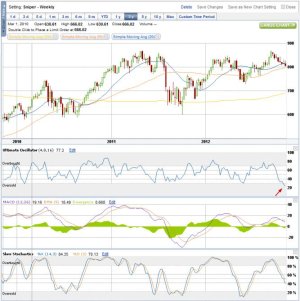
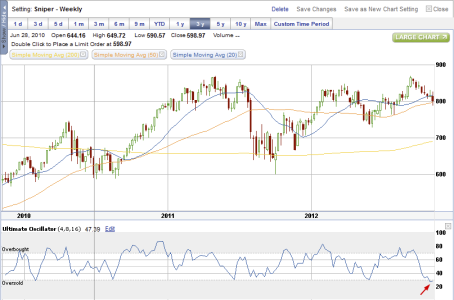
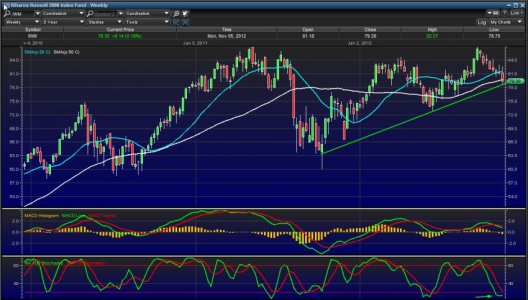
RUT Weekly 3-year chart, showing the oscillator going into major oversold range. To just describe how oversold this is, even in 2008 it wasn't this far into oversold territory. bounce coming? who knows, but it's something to watch. With that said, I need more convincing from the charts before I get bullish.


