I found this week's charts to be very interesting. One set of charts changed very little, while the other changed quite a bit. As usual, I'll start with the Top 50.


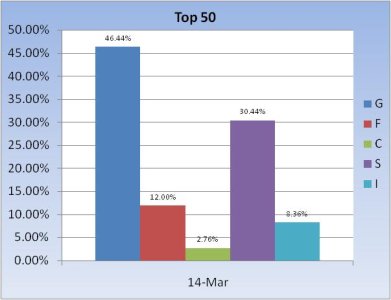
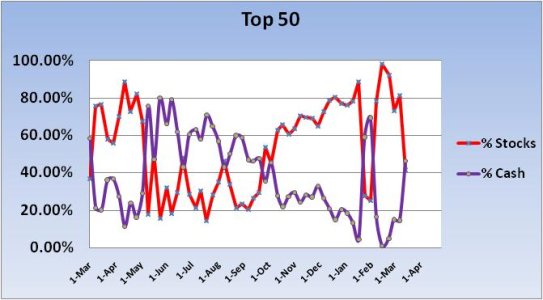
These are the charts that changed markedly. The Top 50 took a much more significant position in cash (G fund), while lowering their collective risk to stocks (C, S, and I funds). In fact, stock allocations were almost cut by half. The week previous they were buying the dip. I'm going to be very curious to see if this shift pays dividends for this week. I am reminded that our sentiment survey was very bearish (bullish) for this coming week and issued a buy signal for the S fund.


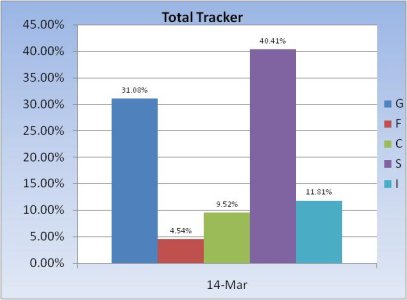
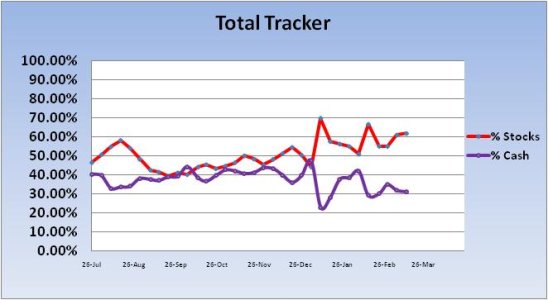
By contrast, the Total Tracker charts changed very little. Given how the Top 50 sold stocks, it appears this group was buying them (modestly so). Overall, it looks like we're holding our collective breath to see what happens next.


These are the charts that changed markedly. The Top 50 took a much more significant position in cash (G fund), while lowering their collective risk to stocks (C, S, and I funds). In fact, stock allocations were almost cut by half. The week previous they were buying the dip. I'm going to be very curious to see if this shift pays dividends for this week. I am reminded that our sentiment survey was very bearish (bullish) for this coming week and issued a buy signal for the S fund.


By contrast, the Total Tracker charts changed very little. Given how the Top 50 sold stocks, it appears this group was buying them (modestly so). Overall, it looks like we're holding our collective breath to see what happens next.
