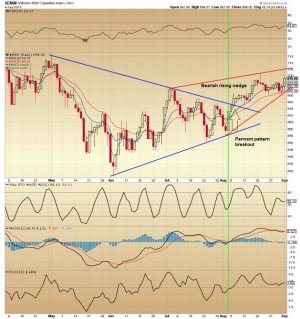
The small-cap and mid-cap stocks have been moving up since June. Consider the Wilshire 4500 index on the chart below. We see a large pennant pattern that started to form in May/June and broke out to the upside in early August. A bearish rising wedge is in play now with a 705 and rising target. Chart indicators RSI are not overbought yet, Rate of Change (ROC) is positive and above the zero line, and MACD and stochastic momentum indicators are neutral to positive. However, the stochastic on the weekly chart of the Wilshire 4500 is overbought and is showing a negative cross with declining momentum, but is still over 80; the dividing line. Turning back to the daily; if 688 or the lower line of the bearish rising wedge offering support would break, then it is a different story and September would live up to its reputation. Under this scenario, an initial drop to support in the 675 region is very possible.


