The last trading day of the month and quarter started out with a gap higher and for a very short period of time looked like it might gap and go, but profit taking took its toll early on and kept the major averages close to their opening levels by the close.
Prior to the open, market data looked like it was going to provide the spark the market needed to have a big day. The third estimate on second quarter GDP showed an annualized growth rate of 1.7%, which was 0.1% higher than previously estimated. We also saw a 2.2% increase in personal consumption, which was up .02% from its initial report. Core personal consumption was revised lower to 1.0%, which was down slightly from 1.1%.
Initial jobless claims came in at 453,000, which was 4,000 less than anticipated, while continuing claims dropped 83,000 to 4.46 million.
Finally, the September Chicago PMI reading came in at a better than expected 60.4.
So what was supposed to be a weak month from a historical perspective, ended with a gain of 9.0% for the S&P 500. That's the best showing for this month since 1939. Obviously a testament to the strong underlying fundamentals of the current global economy.
Here's the charts:

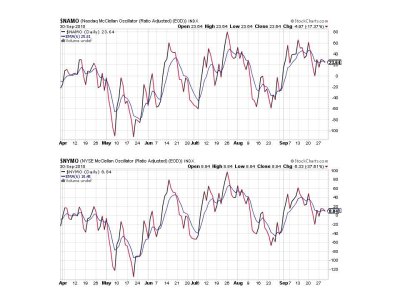
Two sells for NAMO and NYMO, but they're sitting right at their 6 day EMAs, so not too much can be read into this.

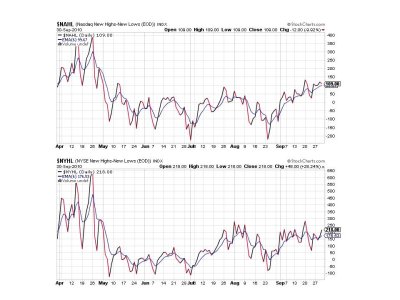
NAHL remained on a buy, while NYHL actually showed a bit of strength and also remained on a buy.

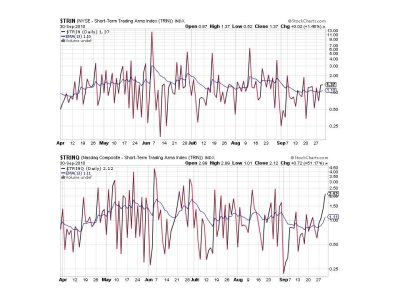
TRIN is still flashing a sell as is TRINQ, but TRINQ is showing a bit of an oversold reading.

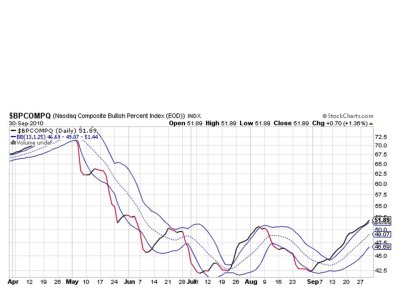
BPCOMPQ is not backing down. It actually put a bit of air between it and that upper bollinger band today. This is certainly suggestive that the intermediate term up-leg is still intact, even if we get some short term weakness now that the third quarter is over.
So we have 3 of 7 signals still flashing buys, which keeps the system on a buy. My short term system went to a sell today, but I'm not expecting a deep correction with sentiment still decidely bearish overall. Our own sentiment survey, while a bit more bullish this week, still had plenty of bears looking for weakness and so remains on a buy for next week.
I chose to play it safe and went 80% cash until I see how the new month is going to start out. Today's action in the market was difficult to gauge, but profit taking was evident.
But don't take my 80% move to cash today to be a sign that I'm bearish. I'm not. But I do suspect a buying opportunity may present itself early on in the month of October and I'd like to be in a position to buy it if all indicators remain the same.
Prior to the open, market data looked like it was going to provide the spark the market needed to have a big day. The third estimate on second quarter GDP showed an annualized growth rate of 1.7%, which was 0.1% higher than previously estimated. We also saw a 2.2% increase in personal consumption, which was up .02% from its initial report. Core personal consumption was revised lower to 1.0%, which was down slightly from 1.1%.
Initial jobless claims came in at 453,000, which was 4,000 less than anticipated, while continuing claims dropped 83,000 to 4.46 million.
Finally, the September Chicago PMI reading came in at a better than expected 60.4.
So what was supposed to be a weak month from a historical perspective, ended with a gain of 9.0% for the S&P 500. That's the best showing for this month since 1939. Obviously a testament to the strong underlying fundamentals of the current global economy.
Here's the charts:

Two sells for NAMO and NYMO, but they're sitting right at their 6 day EMAs, so not too much can be read into this.

NAHL remained on a buy, while NYHL actually showed a bit of strength and also remained on a buy.

TRIN is still flashing a sell as is TRINQ, but TRINQ is showing a bit of an oversold reading.

BPCOMPQ is not backing down. It actually put a bit of air between it and that upper bollinger band today. This is certainly suggestive that the intermediate term up-leg is still intact, even if we get some short term weakness now that the third quarter is over.
So we have 3 of 7 signals still flashing buys, which keeps the system on a buy. My short term system went to a sell today, but I'm not expecting a deep correction with sentiment still decidely bearish overall. Our own sentiment survey, while a bit more bullish this week, still had plenty of bears looking for weakness and so remains on a buy for next week.
I chose to play it safe and went 80% cash until I see how the new month is going to start out. Today's action in the market was difficult to gauge, but profit taking was evident.
But don't take my 80% move to cash today to be a sign that I'm bearish. I'm not. But I do suspect a buying opportunity may present itself early on in the month of October and I'd like to be in a position to buy it if all indicators remain the same.
