Sensei
TSP Pro
- Reaction score
- 27
Re: Sensei's Account Talk
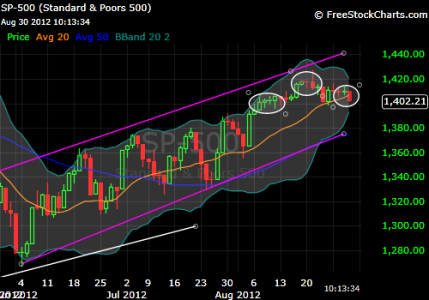
Looking back over the last six months, I saw that there was a time (in the ellipse) that the SPX was up 8 out of 9 days, and the formation looked similar to what we have now. Price elevated well above the 20 day SMA and rolled over until it bounced off it as support. The difference was that, at that time, the S&P's price was outside the bollinger band for a few days. Now, thanks to the last 4 days of flatness, price is well inside the bollies and the 20 day is starting to rise up. We could see a little more consolidation, or we could just keep heading up.
It may or may not be relevant to note that the formation in the circle I'm referring to was basically the beginning of the end of our beloved Dec-Apr bull market. I'm watching with interest.
View attachment 19937
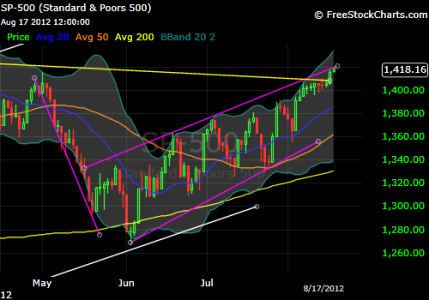
I drew the bear flag a couple weeks ago, but didn't remove it. Extended it out. It looks more like an upward channel to me, though Tom has been pointing it out as a "rising wedge" of late. Whatever you want to call it, you can see that yellow resistance line overhead, so I'm looking for a pullback to the 20 day at 1380. If that doesn't hold, the 50 day and bottom of the channel would be down around 1360. But I think there's too much bearishness to drop that far at this time. We might not even see 1380. I might re-enter 100% if we get to 1390 before the noon deadline in the next couple days.I see a huge bear flag, though it looks like we should have dropped by now.


