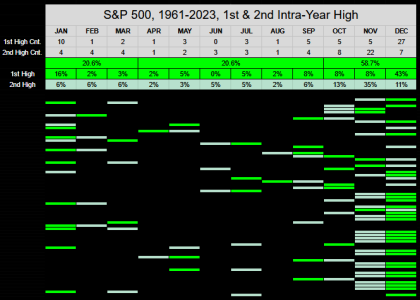
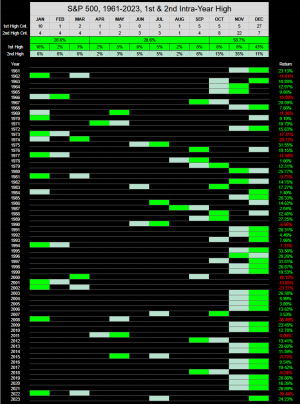
Here's the S&P 500's 1st & 2nd Intra-Year High sorted by month in color-coded form.
As you might envision, 58.7% of the yearly high falls within the 4th quarter, and 43% in December. Looking ahead into August, only one 1st & 2nd Intra-year high fall within this month.
An observation not really applicable here, on the 17 years the index closed down, (with the exception of 2018) the Intra year high was not found in the 4th quarter.
I'm posting 2 versions of this chart, short-form and long-form so you can identify the years & yearly returns.


Cheers...Jason
As you might envision, 58.7% of the yearly high falls within the 4th quarter, and 43% in December. Looking ahead into August, only one 1st & 2nd Intra-year high fall within this month.
An observation not really applicable here, on the 17 years the index closed down, (with the exception of 2018) the Intra year high was not found in the 4th quarter.
I'm posting 2 versions of this chart, short-form and long-form so you can identify the years & yearly returns.


Cheers...Jason

