Happy New Year
This is the 3rd & final of a three-part series starting off 2024 with blogs covering the Yearly, Quarterly, and Monthly timeframe.
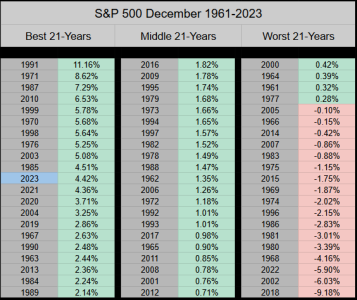
Ranking 11th of 63, December of 2023 closed up 4.42% making it a Top 17% close across the past 63 months of December. Our MTD intra-high was 5.13% ranking 11th, and our MTD intra-low was -.28% ranking 9th best.
___
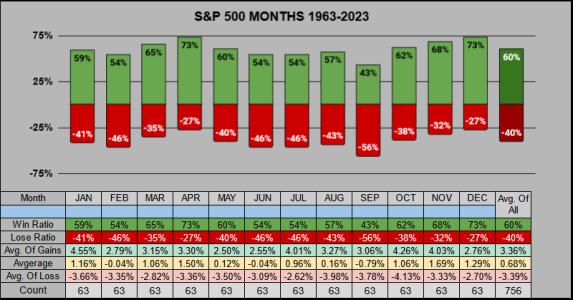
We are now using a new 63-year timeframe from 1961-2023. Comparing the 12 months, January does have a “very average” win ratio, but when it does win it wins big, having the best average-of-gains at 4.55%. Conversely when it loses, it ranks 4th worst with a -3.66% average-of-losses.
___
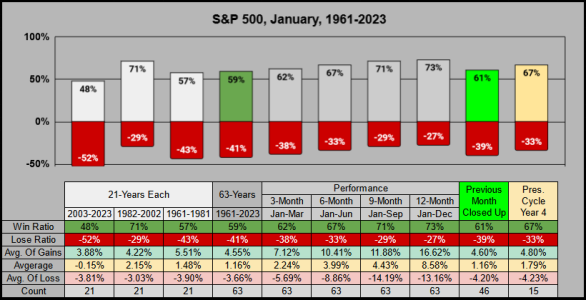
Over the past 21 years, January has not been very kind, giving us a 48% win ratio. But given that December closed up and this is Presidential Cycle year 4, we still have some decent win ratios on our side. Over this most recent 21 year period our yearly win ratio was 76%, so a down January does not necessarily lead to a down year.
___
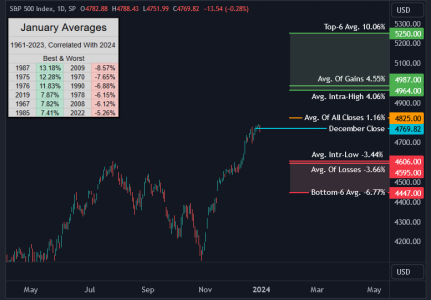
Here’s the January averages across the past 63 years correlated with January 2024. From a historical perspective, a seller may want to protect their gains above SPX 4825 while a buyer may want to increase their allocations below SPX 4606.
___
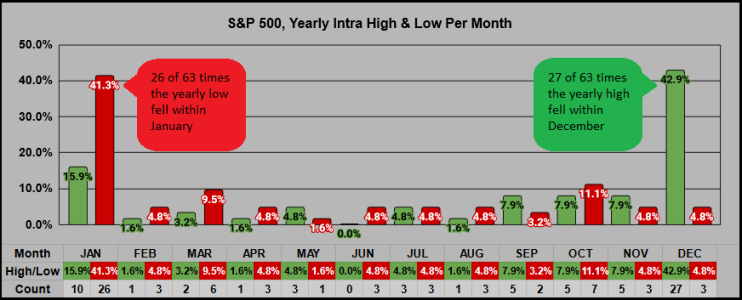
The chart below shows the occasions when the yearly intra-low fell within each month. Happening 26 times, 41.3% of intra-year lows fell within January. When this happened, the year closed up all 26 times, giving us an average gain of 21.48%.
In an ideal scenario (similar to the Q1 Blog) we want January to go as low as it wants to, then for the following months we’d rather not see the January low get breached.
Thanks for reading, have a great month, quarter, & year… Jason
This is the 3rd & final of a three-part series starting off 2024 with blogs covering the Yearly, Quarterly, and Monthly timeframe.
Ranking 11th of 63, December of 2023 closed up 4.42% making it a Top 17% close across the past 63 months of December. Our MTD intra-high was 5.13% ranking 11th, and our MTD intra-low was -.28% ranking 9th best.

___
We are now using a new 63-year timeframe from 1961-2023. Comparing the 12 months, January does have a “very average” win ratio, but when it does win it wins big, having the best average-of-gains at 4.55%. Conversely when it loses, it ranks 4th worst with a -3.66% average-of-losses.

___
Over the past 21 years, January has not been very kind, giving us a 48% win ratio. But given that December closed up and this is Presidential Cycle year 4, we still have some decent win ratios on our side. Over this most recent 21 year period our yearly win ratio was 76%, so a down January does not necessarily lead to a down year.

___
Here’s the January averages across the past 63 years correlated with January 2024. From a historical perspective, a seller may want to protect their gains above SPX 4825 while a buyer may want to increase their allocations below SPX 4606.

___
The chart below shows the occasions when the yearly intra-low fell within each month. Happening 26 times, 41.3% of intra-year lows fell within January. When this happened, the year closed up all 26 times, giving us an average gain of 21.48%.
In an ideal scenario (similar to the Q1 Blog) we want January to go as low as it wants to, then for the following months we’d rather not see the January low get breached.

Thanks for reading, have a great month, quarter, & year… Jason
