The 63-Day Linear Regression Channel has a declining slope of 13.58, meaning the index has lost -13.58% over the past 63 sessions.
For 2025 we are 31-Sessions into our declining slope, the historical average is 46 sessions.
From 1962 to 2024, the 63-Day LRC slope has declined 117 times.
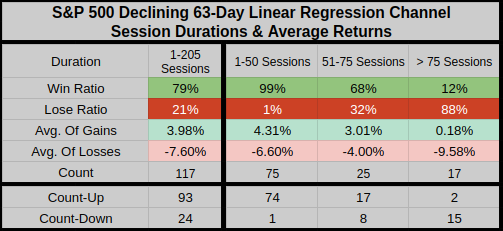
Measuring the percentage performance of a rolling 63-day LRC can be tricky to convey directly, so for the purposes of the table below, I'm using the closing prices from the start to the end of each decline - this is where the gains and losses come from.
Although the gains are generally smaller, it might surprise you to learn that the win ratio is a respectable 79%. Interestingly, the shorter the duration, the better the outcome: declines lasting 50 sessions or fewer have produced a 99% win ratio. And although less frequent, longer declines tend to result in larger losses.

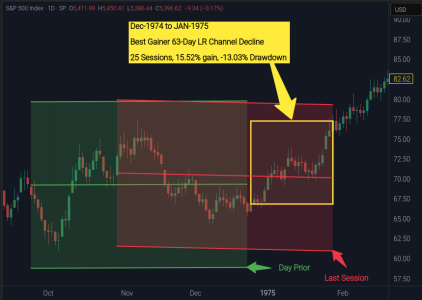
The best 63-LRC decline on record lasted just 25 sessions and produced a 15.52% gain.
This is one of those occasions where the -13.03% drawdown didn’t exceed the eventual gain, meaning if you simply held, you came out unscathed.
For context: this occurred at the tail end of a prolonged bear market. That low candlestick on the left side of the green channel marks the final low of the 1973–1974 bear market, which saw a total decline of -49.93%.

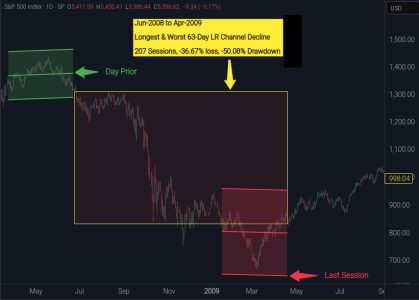
The worst 63-LRC decline on record was also the longest, lasting 207 sessions and resulting in a -36.67% loss.
The drawdown during that period reached -50.08%, this included the infamous 666.79 low from March 6, 2009.
For context: this too, occurred at the tail end of a bear market. That low candlestick on the right side of the red channel marks the final low of the 2007-2009 bear market, which saw a max drawdown of -57.69%.

As previously mentioned, our current slope decline is 13.58, ranking as the 22nd worst out of over 16,000 sessions.
The 21 slope session declines that were worse all occurred during the Mar/Apr 2020 COVID era. This was a 52-session decline resulting in a -1.66% loss, which also covered the final low of that bear market.
Thanks for reading...Jason
For 2025 we are 31-Sessions into our declining slope, the historical average is 46 sessions.
From 1962 to 2024, the 63-Day LRC slope has declined 117 times.
Measuring the percentage performance of a rolling 63-day LRC can be tricky to convey directly, so for the purposes of the table below, I'm using the closing prices from the start to the end of each decline - this is where the gains and losses come from.
Although the gains are generally smaller, it might surprise you to learn that the win ratio is a respectable 79%. Interestingly, the shorter the duration, the better the outcome: declines lasting 50 sessions or fewer have produced a 99% win ratio. And although less frequent, longer declines tend to result in larger losses.

The best 63-LRC decline on record lasted just 25 sessions and produced a 15.52% gain.
This is one of those occasions where the -13.03% drawdown didn’t exceed the eventual gain, meaning if you simply held, you came out unscathed.
For context: this occurred at the tail end of a prolonged bear market. That low candlestick on the left side of the green channel marks the final low of the 1973–1974 bear market, which saw a total decline of -49.93%.

The worst 63-LRC decline on record was also the longest, lasting 207 sessions and resulting in a -36.67% loss.
The drawdown during that period reached -50.08%, this included the infamous 666.79 low from March 6, 2009.
For context: this too, occurred at the tail end of a bear market. That low candlestick on the right side of the red channel marks the final low of the 2007-2009 bear market, which saw a max drawdown of -57.69%.

As previously mentioned, our current slope decline is 13.58, ranking as the 22nd worst out of over 16,000 sessions.
The 21 slope session declines that were worse all occurred during the Mar/Apr 2020 COVID era. This was a 52-session decline resulting in a -1.66% loss, which also covered the final low of that bear market.
Thanks for reading...Jason
Last edited:
