Greetings
This is the 2nd of a three-part series starting off 2024 with blogs covering the Yearly, Quarterly, and Monthly timeframe.
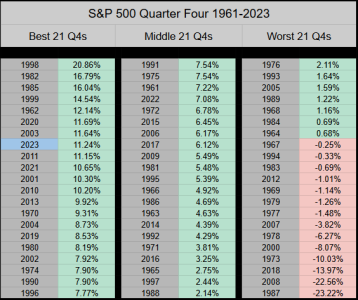
Ranking 8th of 63, Q4 of 2023 closed up 11.24% making it a Top 13% close across the past 63 years of 4th Quarters. Our QTD High (not much higher) was 11.78% ranking 13th, and our QTD low was -4.30% ranking 39th best.
___
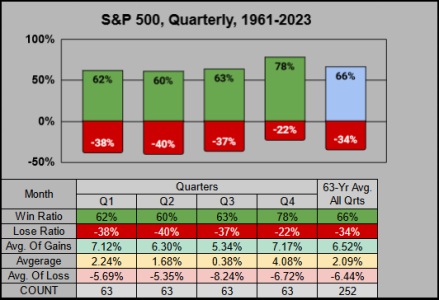
With a new year we roll the statistics forward, and are now using the 63-year timeframe from 1961-2023. Overall, while Q1’s 62% win ratio is the 2nd lowest of the four quarters (in terms of gains & losses) Quarter 1 ranks as 2nd best.
___
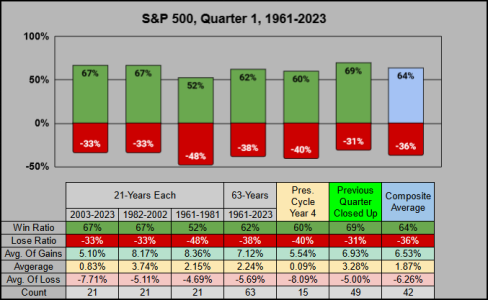
Across the past 21 & 42 Years the 1st Quarter has a 67% win ratio. When the previous 4th Quarter closed up (as with Q4 2023) our win ratio was 69%. During the 15 years of Presidential Cycle Year 4, the win ratio drops to 60% with -8.09% as the average-of-losses. This is partially due to the -20% loss in Q1 of 2020 (the COVID low).
___
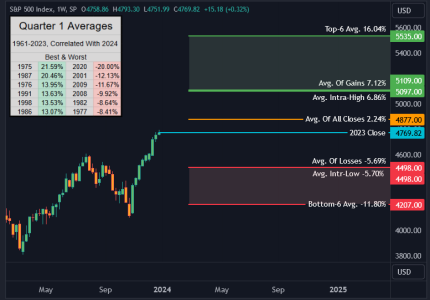
Here’s our 1st Quarter averages across the past 63 years correlated with Q1 of 2024. From a historical perspective, a seller may want to protect their gains above SPX 4877 while a buyer may want to increase their allocations below SPX 4498.
___
I should acknowledge this is a yearly set of statistics "in the real world" we don’t get to reset our accounts each year. Keeping this in mind, here’s where it gets interesting.
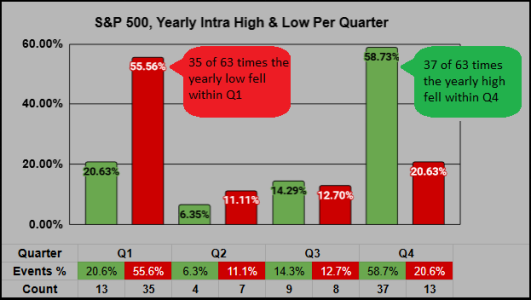
From 1961-2023 the intra-year low fell within the 1st quarter 55% of the time (35 of 63 times). For buyers looking for an entry, of those 35 times our yearly low was in the 1st Quarter, the 1st quarter closed down 6 times, and the year closed positive all 35 times for an average 19.53% gain.
Long story short, we want the intra-year low to fall within the 1st quarter because when the 1st quarter's low is breached in Q2/Q3/Q4, the yearly win ratios drop.
For the Intra-year lows:
_Of the 35 times the Yearly low was made in Q1. the yearly win ratio was 100%
_Of the 7 times the Yearly low was made in Q2. the yearly win ratio was 71%
_Of the 8 times the Yearly low was made in Q3. the yearly win ratio was 50%
_Of the 13 times the Yearly low was made in Q4. the yearly win ratio was 15%
For the Intra-year highs:
_Of the 13 times the Yearly high was made in Q1. the yearly win ratio was 8%
_Of the 4 times the Yearly high was made in Q2. the yearly win ratio was 25%
_Of the 9 times the Yearly high was made in Q3. the yearly win ratio was 79%
_Of the 37 times the Yearly high was made in Q4. the yearly win ratio was 100%
Thanks for reading… Jason
This is the 2nd of a three-part series starting off 2024 with blogs covering the Yearly, Quarterly, and Monthly timeframe.
Ranking 8th of 63, Q4 of 2023 closed up 11.24% making it a Top 13% close across the past 63 years of 4th Quarters. Our QTD High (not much higher) was 11.78% ranking 13th, and our QTD low was -4.30% ranking 39th best.

___
With a new year we roll the statistics forward, and are now using the 63-year timeframe from 1961-2023. Overall, while Q1’s 62% win ratio is the 2nd lowest of the four quarters (in terms of gains & losses) Quarter 1 ranks as 2nd best.

___
Across the past 21 & 42 Years the 1st Quarter has a 67% win ratio. When the previous 4th Quarter closed up (as with Q4 2023) our win ratio was 69%. During the 15 years of Presidential Cycle Year 4, the win ratio drops to 60% with -8.09% as the average-of-losses. This is partially due to the -20% loss in Q1 of 2020 (the COVID low).

___
Here’s our 1st Quarter averages across the past 63 years correlated with Q1 of 2024. From a historical perspective, a seller may want to protect their gains above SPX 4877 while a buyer may want to increase their allocations below SPX 4498.

___
I should acknowledge this is a yearly set of statistics "in the real world" we don’t get to reset our accounts each year. Keeping this in mind, here’s where it gets interesting.
From 1961-2023 the intra-year low fell within the 1st quarter 55% of the time (35 of 63 times). For buyers looking for an entry, of those 35 times our yearly low was in the 1st Quarter, the 1st quarter closed down 6 times, and the year closed positive all 35 times for an average 19.53% gain.
Long story short, we want the intra-year low to fall within the 1st quarter because when the 1st quarter's low is breached in Q2/Q3/Q4, the yearly win ratios drop.

For the Intra-year lows:
_Of the 35 times the Yearly low was made in Q1. the yearly win ratio was 100%
_Of the 7 times the Yearly low was made in Q2. the yearly win ratio was 71%
_Of the 8 times the Yearly low was made in Q3. the yearly win ratio was 50%
_Of the 13 times the Yearly low was made in Q4. the yearly win ratio was 15%
For the Intra-year highs:
_Of the 13 times the Yearly high was made in Q1. the yearly win ratio was 8%
_Of the 4 times the Yearly high was made in Q2. the yearly win ratio was 25%
_Of the 9 times the Yearly high was made in Q3. the yearly win ratio was 79%
_Of the 37 times the Yearly high was made in Q4. the yearly win ratio was 100%
Thanks for reading… Jason
