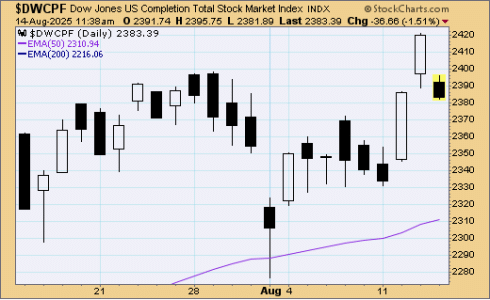
S Fund

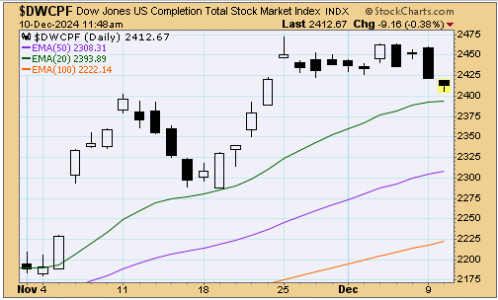
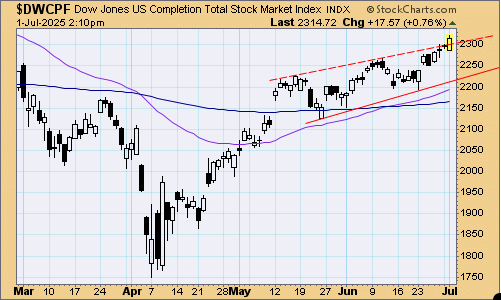
Fascinates me how this fund hit around 2400 over a year ago, then lost close to 40% of its value last year, and is currently sitting about 30% from those highs.

The rich keep getting richer. This allows them to buy companies with new tech before they can go public or become profitable. Turnover on the Vanguard extended market fund (similar to DJW4500) is 11.3% compared to 2.1% for the Vanguard 500 fund.

Below was from a few months ago, but I doubt much has changed besides NVDA taking more of the market.

Apple, Microsoft and Nvidia alone are responsible for more than half of the index’s gains this year, with Alphabet, Amazon, Meta and Tesla contributing another 34 percent. Taking these companies out of the equation, the S&P 500 would have returned a meager 1.88 percent this year and no one would be talking about a bull market right now.

https://www.statista.com/chart/30219/main-contributors-to-s-p-500-gains-in-2023/

While C fund has stability, S fund is revolving door with stocks getting dropped on a monthly basis.

Turnover on the Vanguard extended market fund (similar to DJW4500 but only has 3,000 stocks) is 11.3% compared to 2.1% for the Vanguard 500 fund. Add in an extra 1,500 small caps and that turnover is guaranteed to be higher.

See also below for sector breakdowns and PE ratios as of 2021. Trailing P/E at the time was 74, P/B was 2.98, and P/S was 21 - far from being a bargain.

https://assets-global.website-files.com/60f8038183eb84c40e8c14e9/613422439b14d099a5d278de_wilshire-4500-fact-sheet.pdf

Interesting bit on the index methodology below.

https://assets-global.website-files...5a36cec4ef397d6_Wilshire-4500-methodology.pdf

Also, I wouldn't worry about P/E's if you looking for a market timing indicator. It's useless in 2024. Back when Ben Graham wrote his first editions it meant something but since his later editions in the 1970's even he said his methods of valuation no longer worked.

According to the Schiller PE, the stock market has been in a state of overvaluation since around 1980. In 2008 it touched the "average" PE, the closest it's come to an undervaluation signal since.
 
The bottom of the open gap created on May 5 can technically be the closing price from May 4, so there may be some wiggle room below from the original way I drew the gap.

tsp-102523b.gif
 
Small caps are battling back from the slow start and yesterday's big decline. The problem is, they (Russell 2000 and S-fund) haven't filled their of their recent gaps yet.

tsp-110723b.gif
 
Two small gaps opened overhead while one large gap gets filled (blue).

It might hold as support - might not, but that's one gap we don't have to worry about anymore. The others? :blink:

tsp-010324b.gif
 
Those who are fully invested are bold right now, yet it's easy to enjoy holding the S-fund lately. It has increased the wealth of its investors more than any other TSP fund in the last three months.

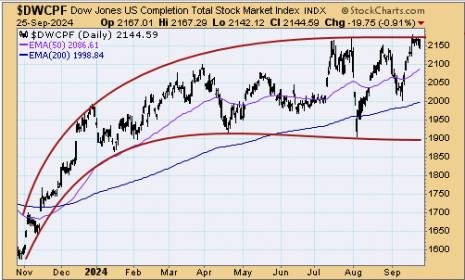
Today the S-fund fell 0.9% in a steady sell-off. But even the bulls should welcome a healthy amount of profit taking that doesn't kickstart a sudden significant pull-back. The index is at the peak of prices and has had a tendency to oscillate sharply this year.

Sfund092524.jpg
 
Can the S-fund do it again next year?

Small caps have had some really big years, but also some account crushing years. Right now it's in the midst of back to back +25% years, if this year's gains can hold. It would be very tough, but with a month left to go, it has an outside chance of being the best year for the S-fund - 2003's +42.9%.

DateS Fund
2024+25.63%
2023+25.30%
2022-26.26%
2021+12.45%
2020+31.85%
2019+27.97%
2018-9.26%
2017+18.22%
2016+16.35%
2015-2.92%
2014+7.80%
2013+38.35%
2012+18.57%
2011-3.38%
2010+29.06%
2009+34.85%
2008-38.32%
2007+5.49%
2006+15.30%
2005+10.45%
2004+18.03%
2003+42.91%
2002-18.14%

Small caps also gained 40% plus in 1991
 
Last edited:
Back
Top