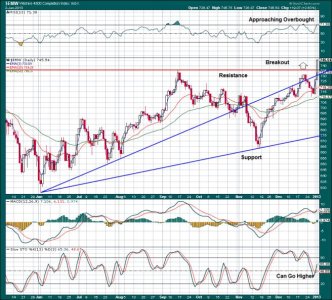
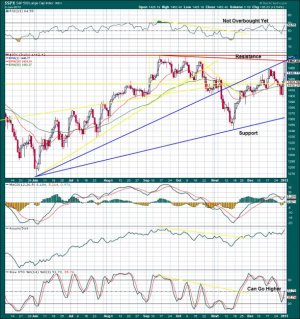
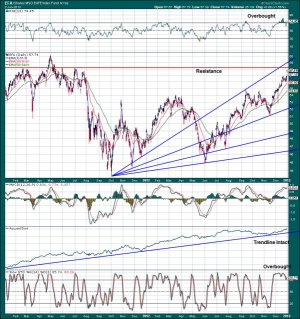
The apparent Fiscal Cliff resolution really juiced the markets for the last two sessions. For example, SPX gained 64 points (1398-1462 or 4.5%) in just two trading days! Nearby overhead resistance looms as viewed on the SPX and EFA charts representing the TSP’s C and I funds, but the Wilshire 4500, used as a surrogate for the TSP’s S fund, shows a breakout. If has never been at the 745 level before! The Wilshire 4500 RSI is approaching overbought, but the slow Stochastic indicates that the S fund can roll higher. Past history shows that the Wilshire 4500 is very strong in January for reasons unknown to me.
Even though the SPX is approaching horizontal and diagonal resistance, the slow Stochastic suggests that it can go higher as well, such as the low 1470 area, before rolling over. The EFA is not far from significant overhead resistance and is overbought. General contrarian sentiment for equities (based on options movements) has now turned positive, due to increasing bearishness. So to conclude, I expect a pause or slight decline, due to very short term being extremely overbought, and then a move higher, particularly for the S fund, until bullishness reappears.


Even though the SPX is approaching horizontal and diagonal resistance, the slow Stochastic suggests that it can go higher as well, such as the low 1470 area, before rolling over. The EFA is not far from significant overhead resistance and is overbought. General contrarian sentiment for equities (based on options movements) has now turned positive, due to increasing bearishness. So to conclude, I expect a pause or slight decline, due to very short term being extremely overbought, and then a move higher, particularly for the S fund, until bullishness reappears.


