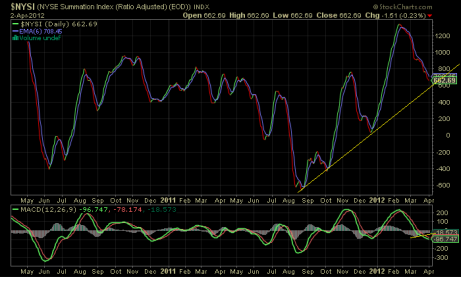
The structure under the market is not supporting price at this time, and this is concerning. The NY summation index that is one way of tracking this sort of thing, shows a decline since early February, when it dropped below the 6 ema and so far cannot regain it. On the other hand, we see a support region just below, where I have drawn the yellow line. Further, the MACD histogram shows a positive divergence, moving in the opposite direction. Which way will it go? I'm taking orders.


