Running For Cover

hiding_The_art_of_hiding-s500x333-38562-580.jpg

As our elected officials continue the biggest game of chicken Washington has seen is some time, the perceived negative financial ramifications of allowing the U.S. to default is beginning to take its toll on the psyche of traders and investors as the deadline to avert such a disaster is now only hours away.

Of the two groups of TSPers that I track, one group is definitely taking a much more conservative approach this week as a result of the debt ceiling impasse.
2011 Fund Allocation ~ Top 50 Chart 3.jpg
2011 Cash-Stock Exp ~ Top 50 Chart 1.jpg

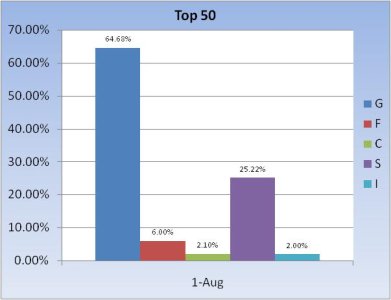
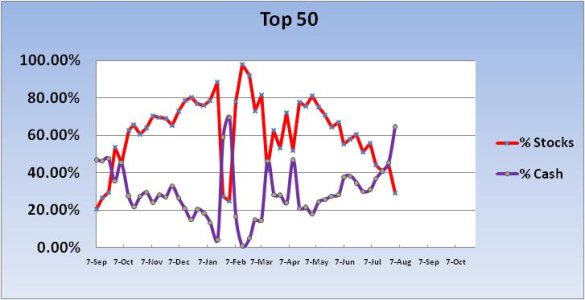
The Top 50 dropped their collective stock allocation by over 15% this week. They now hold a fairly modest 29.32% stock allocation, while loading up the G fund to the tune of 64.68%.
Total Fund Allocation Chart 3.jpg
2011 Cash-Stock Total Exp Chart 1.jpg

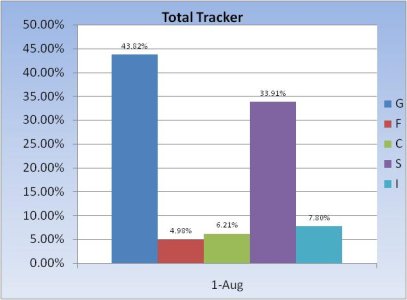
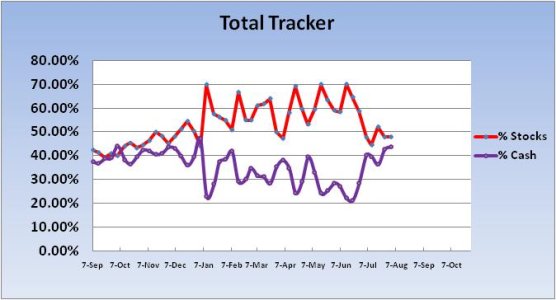
The herd on the other hand, is pretty much holding steady from the previous week, but their collective stock allocation is still only moderately bullish at 47.93%.

Our sentiment survey is on a hold (buy) for this coming week after showing a 36% Bullish reading, while the Bearish number is 55%. Is this good news? Often it is, but we were on a hold (buy) last week too only to see the C fund drop 3.91%, while the S fund fell a whopping 4.90%. Will it be wrong two weeks in a row?

We may know the answer to that question by Tuesday. And it could be quite a ride depending on what happens (or doesn't happen).
 
Nearly 50% still in stocks?

That seems to indicate that IF a debt deal is not reached in time...there are still enough sellers around for a "blood in the streets" sell-off.
 
Thank you Cool for the best laugh I've had all week (kitten peeking-hiding pic). first thing I saw when I clicked the link. spontaneous laugh out loud, still chuckling. need some laughs these days. still hiding in G where I've been awhile. plan to stay there a bit longer too-will be out of town for funeral and family time, no access for a couple weeks.
 
FWM,

Who cares about the Debt Ceiling Deal. The real one will be when folks don't want to buy our debt. Moody's looks to downgrade our debt in three months if we don't get our deficit under more control.

By the way, I don't think the 'G Fund' is the place to be if the debt ceiling is not raised. They have already securitized it - much like Bear Sterns securitized mortgages. They might have to freeze your mulla from IFT transfers. That would be depressing.

However, that is my pet peeve. And, look at where it got me.:embarrest:
 
You're not one of those "mug is half empty" kinda guys are you? :D

You may want to check futures. They opened up kinda high. :nuts:

FireWeatherMet;bt3655 said:
Nearly 50% still in stocks?

That seems to indicate that IF a debt deal is not reached in time...there are still enough sellers around for a "blood in the streets" sell-off.
 
That might be the highest G-Fund allocation I've seen on the top 50, can you confirm?
 
JTH;bt3660 said:
That might be the highest G-Fund allocation I've seen on the top 50, can you confirm?

Technically, it was a bit higher at the end of January, but because our tracker data resets each calendar year the first few weeks tend to be somewhat trendless as everyone starts out at the same starting point (0.00%). You can see the trend lines smooth out as we get deeper into the year.

When we finally hit a bear market we'll see cash rule at the top of the tracker. As you know, the rules change when that happens.
 
If you are taking the top 50, and the people are actually not remaining constant, its quite possible the G fund allocations rose because the stocks were down due to people in stocks being "passed" by people in the G or F.

For example, looking at the numbers today, if the C/S/I all lost 2.54% today (or over a couple days without allocations changing), 13 people in stocks would drop out of the top 50 and be replaced by people in the G/F. Thats a 26% drop out. So even without actual allocation changes, when stocks move, the allocation percentages would change.
:confused:
 
That is true to a limited extent. To what extent depends on how much selling has passed. Until yesterday, the selling had been somewhat limited the previous three trading days. But yesterday's action was ugly enough to raise a lot of G fund boats on the tracker. My charts only show where we were for Monday morning and do not reflect the latest carnage.

The charts are only suppose to show a general trend all things considered.

k0nkuzh0n;bt3671 said:
If you are taking the top 50, and the people are actually not remaining constant, its quite possible the G fund allocations rose because the stocks were down due to people in stocks being "passed" by people in the G or F.

For example, looking at the numbers today, if the C/S/I all lost 2.54% today (or over a couple days without allocations changing), 13 people in stocks would drop out of the top 50 and be replaced by people in the G/F. Thats a 26% drop out. So even without actual allocation changes, when stocks move, the allocation percentages would change.
:confused:
 
With being limited to 2 transfers per month, I think people moving in and out of the top 50 plays more of a significant role than you would think. My example used just 1 day, but the key part was "without allocations changing". With people having only 2 transfers, any given person can't change daily. And there are probably a good amount of people that don't even use all 2 regularly.

Average YTD IFT's amongst the top 100 right now, prior to the start of this month, is 10.86/person. in 7 months. And thats slightly inflated to the high side due to people using more than 2 IFTs in a month by selling to G.
 
Back
Top