Yields on the 10 Year Note hit fresh 2 year highs this week and that is helping to fuel the current selling pressure across the broader market. I expected this based on the chart of Barclay's Aggregate Bond Fund. That chart was showing a bearish flag pattern that not surprisingly broke through trend line support this past week. This situation is going to serve as a good excuse to take profits and realign portfolios, but it may also be causing the market to overreact in the short term too. It's still a guessing game where rates are headed longer term and whether current levels are permanent.
I am seeing a mixed picture this week with respect to stock allocation changes for the Top 50 and Total Tracker. Here's the charts:
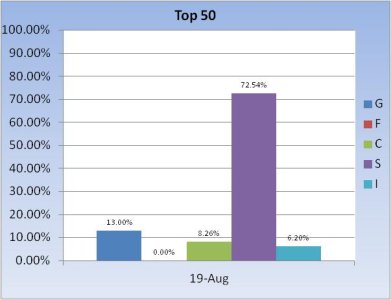
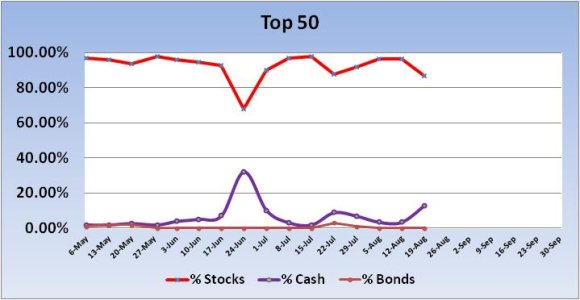
No officialsignal from the Top 50 this week, but as you can see on the trend chart, stock allocations dipped. They fell 9.38%, which is close to a buy signal. It may be enough. But there are other indicators that are on the bearish side. Remember, this group is at the top of the pack for a reason. They are in the upper 5% of the Auto-Tracker. The fact that they are still collectively holding an 87% stock allocation needs to be considered. I think this is bullish longer term.
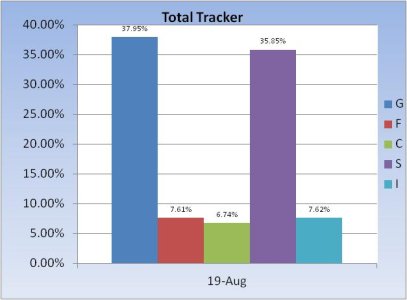
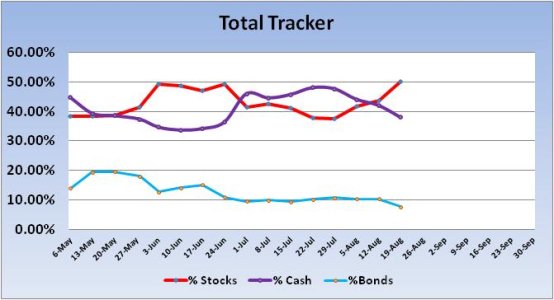
No signal was generated from the Total Tracker this week. However, we have been dip buying for three weeks now. Total stock allocations rose by 6.67% this week alone. That’s not an issue longer term, but it could be a drag on the upside in the short term. You can see on the chart above that total stock allocations are now sitting at about 50%. That’s still a conservative allocation in a bull market so I continue to view this as bullish in the longer term.
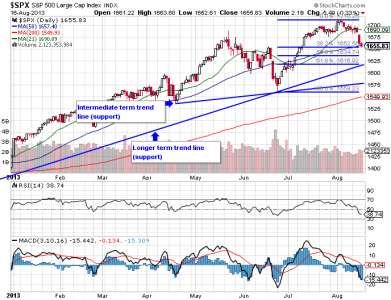
I showed you this chart of the S&P in my alert on Friday. We can now see that price closed just below the 50 day moving average, but right at Fibonacci level (38.2%). We'll have to see if price can hold there. RSI did have a negative centerline cross last week and is still pointing lower. MACD is very negative and pointing lower too. It's a bearish picture, but we've seen this before. I'm thinking we have more downside, but it doesn't have to come quickly. Sentiment is pretty bearish (bullish) in our survey this week. Maybe that helps get things turned in the short term. And the top 50 almost triggered a buy signal. I'm just a little apprehensive about the overall dip buying I'm seeing.
To see this week's full analysis, follow this link http://www.tsptalk.com/members/
I am seeing a mixed picture this week with respect to stock allocation changes for the Top 50 and Total Tracker. Here's the charts:


No officialsignal from the Top 50 this week, but as you can see on the trend chart, stock allocations dipped. They fell 9.38%, which is close to a buy signal. It may be enough. But there are other indicators that are on the bearish side. Remember, this group is at the top of the pack for a reason. They are in the upper 5% of the Auto-Tracker. The fact that they are still collectively holding an 87% stock allocation needs to be considered. I think this is bullish longer term.


No signal was generated from the Total Tracker this week. However, we have been dip buying for three weeks now. Total stock allocations rose by 6.67% this week alone. That’s not an issue longer term, but it could be a drag on the upside in the short term. You can see on the chart above that total stock allocations are now sitting at about 50%. That’s still a conservative allocation in a bull market so I continue to view this as bullish in the longer term.

I showed you this chart of the S&P in my alert on Friday. We can now see that price closed just below the 50 day moving average, but right at Fibonacci level (38.2%). We'll have to see if price can hold there. RSI did have a negative centerline cross last week and is still pointing lower. MACD is very negative and pointing lower too. It's a bearish picture, but we've seen this before. I'm thinking we have more downside, but it doesn't have to come quickly. Sentiment is pretty bearish (bullish) in our survey this week. Maybe that helps get things turned in the short term. And the top 50 almost triggered a buy signal. I'm just a little apprehensive about the overall dip buying I'm seeing.
To see this week's full analysis, follow this link http://www.tsptalk.com/members/
