Stocks picked up where they left off Friday, as the major averages saw moderate to heavy losses. The broader market closed not far off its lows of the day. The S&P 500 dropped 1.08%, the Nasdaq 1.11%, the Dow 0.5%, and the Wilshire 4500 a hefty 1.61%.
We haven't seen these levels since March 23.
Of particular note today was the fact that financials underperformed the broader market as the sector fell about 2.0%.
Crude oil dropped below the $100 dollar market, with a barrel of oil settling near $98.80/barrel.
Interestingly, treasuries were relatively flat today in the face of significant equities selling pressure.
And the dollar index managed a modest gain as the greenback tacked on 0.27%.
So it was a relatively light news day for the market, but the negative tone persists. Looking at the Seven Sentinels however, the signals are suggesting that a reversal may be at hand given the deeply negative levels that are reflected in the charts. Let's take a look:

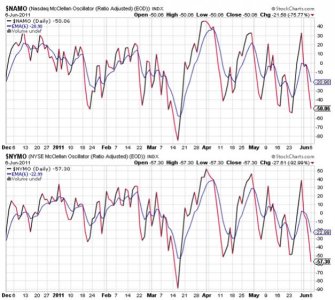
NAMO and NYMO are now at levels that typically see a bounce. Notice the lower lows in NYMO, with NAMO not far off putting in a lower low too should more selling pressure come tomorrow. Both are on sells.

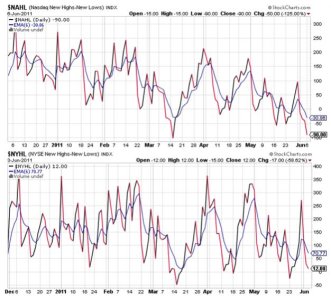
NAHL and NYHL are also in sell conditions.

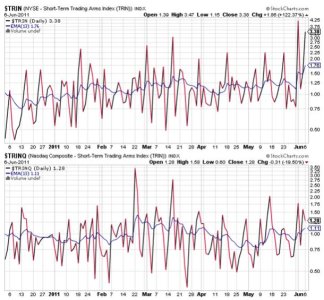
TRIN and TRINQ are flashing sells too, with TRIN suggesting a bounce is near. However, when it hit above this level last week, we didn't get much of a bounce. Market character may not be what it's been for the past nine months, so no guarantees here.

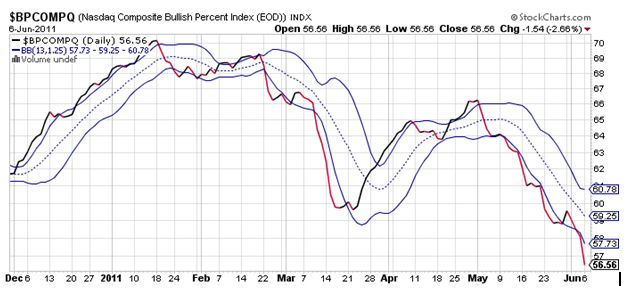
BPCOMPQ looks ominous. It is falling hard and continues to suggest we're going lower. It too is on a sell.
Guess what? All seven signals are flashing sells and NYMO has hit a fresh 28 day trading low. That's a repeat sell as the system was already in a sell condition.
It doesn't look good for the bulls right now, as technicals are getting hit pretty hard. But bearish sentiment is rising, which could help the market find a low before too much longer. I'm not expecting things to fall completely apart. QE2 is still being pumped and I doubt the powers that be will let things get away from them. At least not yet.
We haven't seen these levels since March 23.
Of particular note today was the fact that financials underperformed the broader market as the sector fell about 2.0%.
Crude oil dropped below the $100 dollar market, with a barrel of oil settling near $98.80/barrel.
Interestingly, treasuries were relatively flat today in the face of significant equities selling pressure.
And the dollar index managed a modest gain as the greenback tacked on 0.27%.
So it was a relatively light news day for the market, but the negative tone persists. Looking at the Seven Sentinels however, the signals are suggesting that a reversal may be at hand given the deeply negative levels that are reflected in the charts. Let's take a look:

NAMO and NYMO are now at levels that typically see a bounce. Notice the lower lows in NYMO, with NAMO not far off putting in a lower low too should more selling pressure come tomorrow. Both are on sells.

NAHL and NYHL are also in sell conditions.

TRIN and TRINQ are flashing sells too, with TRIN suggesting a bounce is near. However, when it hit above this level last week, we didn't get much of a bounce. Market character may not be what it's been for the past nine months, so no guarantees here.

BPCOMPQ looks ominous. It is falling hard and continues to suggest we're going lower. It too is on a sell.
Guess what? All seven signals are flashing sells and NYMO has hit a fresh 28 day trading low. That's a repeat sell as the system was already in a sell condition.
It doesn't look good for the bulls right now, as technicals are getting hit pretty hard. But bearish sentiment is rising, which could help the market find a low before too much longer. I'm not expecting things to fall completely apart. QE2 is still being pumped and I doubt the powers that be will let things get away from them. At least not yet.
