Last week, the Top 50 had a total stock allocation of 91.68%, which was quite bullish. Another week of gains helped push that allocation up another 6.32% to an even 98% going into the new week.
It doesn't get much more bullish than that. And last year at this time saw similar market action with high stock allocations by the Top 50 as well. But a weekly decline didn't happen till the second week of February 2012. And still the market moved higher in the following weeks even with stock allocations remaining relatively high into the end of March.
So when the trend is obviously up and selling pressure contained, being bullish is justified. Here's the charts:
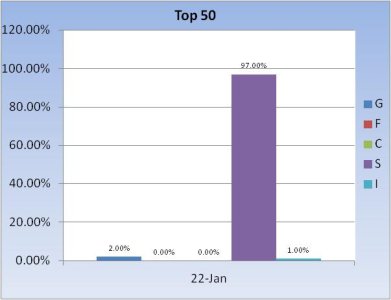
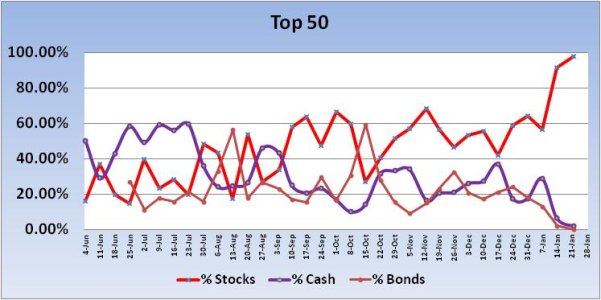
Obviously, the S fund has been the leader thus far this month and those that have been sticking with it are reaping the biggest gains.
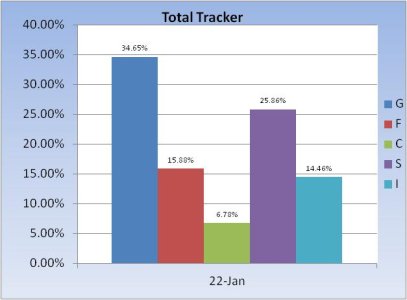
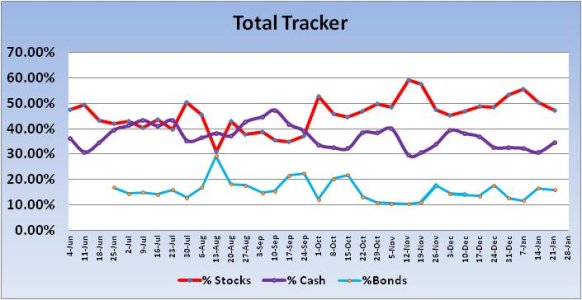
The Total Tracker showed a somewhat modest dip in stock allocations, dropping from 50.3% last week to 47.1% this week.
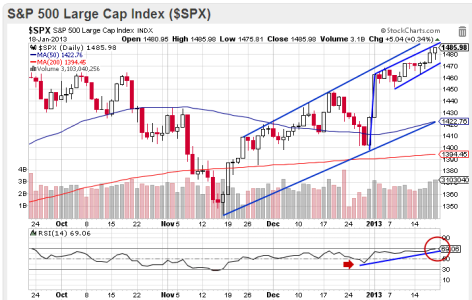
The intermediate term trend remains up and this chart suggests it will remain up for the time being. RSI is not far from overbought territory (70.0). That does not necessarily mean a meaningful pullback is near, but it does suggest that further upside may be limited given the size of the advance over the last 3 weeks or so.
Our sentiment survey came in at 50% bulls vs. 38% bears, which is neutral, but the system remains in a sell condition. Perhaps that signal will pay some dividends soon for those that are short or looking to buy a dip.
It doesn't get much more bullish than that. And last year at this time saw similar market action with high stock allocations by the Top 50 as well. But a weekly decline didn't happen till the second week of February 2012. And still the market moved higher in the following weeks even with stock allocations remaining relatively high into the end of March.
So when the trend is obviously up and selling pressure contained, being bullish is justified. Here's the charts:


Obviously, the S fund has been the leader thus far this month and those that have been sticking with it are reaping the biggest gains.


The Total Tracker showed a somewhat modest dip in stock allocations, dropping from 50.3% last week to 47.1% this week.

The intermediate term trend remains up and this chart suggests it will remain up for the time being. RSI is not far from overbought territory (70.0). That does not necessarily mean a meaningful pullback is near, but it does suggest that further upside may be limited given the size of the advance over the last 3 weeks or so.
Our sentiment survey came in at 50% bulls vs. 38% bears, which is neutral, but the system remains in a sell condition. Perhaps that signal will pay some dividends soon for those that are short or looking to buy a dip.
