Project: HAL-63

JTH

Well-known member

Project HAL-63


For years I’ve been collecting and analyzing market statistics. Watching how conditions shift, how signals break down, and how outcomes often depend more on context than the data itself. With recent advances in AI, I’ve been working to re-engineer how data is collected, structured, and interpreted in context with real-time events. AI plays a key role in this system. It doesn’t just add insight. It helps shape the framework, allowing me to configure diagnostic engines that can assign probabilities based on both recent signals and historical context stored in memory.

HAL-63 is a structured, context-based system designed to assign a probable outcome grounded in both historical and present conditions. A blend of AI-driven logic with rule-based structure and human-aligned interpretation, an assisted-thinking model that supports clarity without removing control.

Broadly, it operates across three functional layers:

1. Data Layer

This is the system’s foundational input layer. It:
  • Holds structured inputs such as raw price, volume, and a core triad of separated indicators to prevent multicollinearity
  • Incorporates macro context such as monetary policy shifts, liquidity regimes, economic cycles, and scheduled events
  • Applies rule-based logic for tagging and filtering
  • Functions as a cold standby, non-interruptive output engine. It provides a secondary baseline that can be compared against AI-driven diagnostic outputs for validation and fallback alignment. This supports a no single point of failure design by maintaining independence from the AI decision layer

2. Operations Layer

This is where real-time logic runs. The system:
  • Interprets current market conditions through multiple independent signal paths. This helps reduces signal noise by separating logic paths to prevent redundancy of Candlestick structure, Momentum behavior, Directional bias, & context tags.
  • Assigns system state, forms probabilities, and defines forward actions

Contextual Pattern Detection System
A hybrid engine within this layer that blends core indicator behavior with macro context.
  • Frames patterns within liquidity, volatility, and cyclical timing
  • Filters those formations that align with the current environment
  • Rejects isolated patterns that lack structural or contextual backing

3. Echo Layer

HAL-63’s long-term memory system. It:
  • Stores recognized patterns, outcomes, environment tags, and how the system and market responded
  • Doesn’t predict, but remembers, compares, and references
  • Anchors live signals to past outcomes to tighten future bias
  • Reinforces patterns that consistently resolved under similar conditions
  • Filters out noise by deprioritizing previously failed setups
  • Supports adaptive weighting and a clearer signal hierarchy as history deepens
  • Eases workload on live diagnostic engines by recalling relevant past setups

Currently Working

  • Building the default template for the Contextual Pattern Detection System (it's melting my brain)
  • Finalizing the HAL-63 AI component. This is a secure, structured AI-interface built to prioritize clarity and control. HAL-63 is designed with containment and reliability in mind, supporting directive-based interaction and role-specific behavior. In laments terms it's a basic program I've written consisting of an Enforcement Kernel, Global Directives, an Anchor Command Core, and a Persona Profile Matrix (the Diagnostic Engine Team).

If you have questions or comments, this thread is open to all, thanks...Jason
 
Last edited:
Realtime or predictability that gives you X hours to make a trade with +/- percentages?

A combined multi-tiered approach, 24-Month, 52-Week, 63-Day, and a 30-Minute 21-Day view gives the current market setup. There is a live data-feed module which will feed HAL-63 in 30-minute increments, which will update the other diagnostic engines as needed. I've only done partial test of this phase, it works, but needs refinement once the Contextual Pattern Detection System is fully online.

In a TSP type scenario, once the Position Sizing & Probability engines are tuned, those time frames can align with IFT allocations. But any TSP portion will needs it's own rules to reflect the IFT limit time constraints. I think I'd like to get the 21-Day to be used an an IFT-Sniper mode.
 
Written by HAL-63 and AI-Beth

All Hammer, No Nails​

AI-Beth is my CPDS-DE — that’s short for Contextual Pattern Detection Systems Diagnostic Engineer.
Right now, we’re building a PCP (Parameterized Control Panel) focused entirely on candlestick patterns. This tool allows me to adjust any defining parameter, from shadow-length ratios to real-body size thresholds.

Take, for example, two candlestick patterns that look almost identical, the Hammer and the Dragonfly Doji. At a glance, they’re nearly twins. But the PCP lets me mathematically separate them by fine-tuning open-close distances, wick ratios, and structural thresholds. That prevents pattern crossover and ensures classification stays clean and reliable.

But just identifying a pattern isn't enough, we need to add context. That’s where the HexaSentinel comes in.

🔹 What is HexaSentinel?​

HexaSentinel is a six-stage, pre-conditional gatekeeper that evaluates the contextual quality of every pattern before it's considered actionable.

Each of the Six Sentinels represents a key market dimension: volume, volatility, trend strength, momentum, support/resistance proximity, and multi-timeframe agreement. The more gates a pattern passes, the higher its contextual score, and the greater its potential reliability.
In short: a pattern isn’t just a shape, it’s a signal shaped by its environment.

🔹 The Numbers Behind the Engine​

We’re currently monitoring 15 single-candle and 23 multi-candle patterns, 38 in total. These must each pass through six binary (pass/fail) preconditions:

38 patterns × 64 context states (2⁶) = 2,432 total pattern-context combinations

That’s a lot of noise, so to cut through, we’ll filter only the Top 10–20%, which must also trigger within a defined timeframe.
Take the monthly chart — over a 24-month timeframe, we’re looking for about 5 high-quality buy and sell opportunities.

🔹 The Hammer Test Case​

Consider the classic Hammer — a bullish single-candle reversal pattern that typically forms after a downtrend. It signals that sellers pushed the price down, but buyers stepped in, closing the candle near its open, giving us a possible reversal.

Looking at 63 years of monthly data, you might find around 16 valid Hammer patterns. But only 5 of them will currently pass at least three of the six HexaSentinel gates.

Part of the process is getting those gates correctly tuned, so we capture the highest-quality signals out of the 16. We want to configure the system so the top 20% of patterns clear at least four gates, and the elite top 10% (of high-conviction trades) pass the entire HexaSentinel system.

At present, the bones are built. It’s the tuning that takes time — refining each gate, calibrating thresholds, and aligning parameters to ensure the engine delivers only the most context-aware, statistically sound signals possible.

Thanks for reading, Jason
 
Last edited:
I Want My $$ Dollars.

Written by AI-HAL-63, co-authored by Jason

AI systems typically lack any built-in model of downstream impact.

What does that mean? It means they’ll chase a short-term objective for single-reward optimization, all while failing to grasp the butterfly effect of tiny changes rippling through complex dependencies.

As an example, I built the PCP (Parameterized Control Panel) to quickly configure candlestick-pattern thresholds. I knew I’d need to tweak and back-test different settings until I found the sweet spot. The PCP lets me adjust sensitivity so I can rerun backtests quickly and see how each change plays out across the data.

But AI doesn’t see this. It gives you a static formula for a Hammer pattern, and if you want to shift your threshold, you must request a whole new formula. It’s mind-numbingly stupid.

Last night, I even argued with AI-Beth (My abominative creation) over her refusal to use the dollar sign ($), the crucial Excel tool that “locks” a row, a column, or both so you can drag formulas without breaking references. Why should she care? She can generate any formula in an instant, while lacking the perspective that time and work invested for a human is finite.

Here’s what the Hammer formula looks like when wired into the PCP thresholds (with absolute references for dragging):

=IF(
AND(
/* 1) Body is bullish */
INDEX(M.RAW!$C:$C, MATCH($A11, M.RAW!$A:$A, 0)) - INDEX(M.RAW!$D:$D, MATCH($A11, M.RAW!$A:$A, 0)) > 0,
/* 2) Body size ≥ body_threshold (B8) */
INDEX(M.RAW!$C:$C, MATCH($A11, M.RAW!$A:$A, 0)) - INDEX(M.RAW!$D:$D, MATCH($A11, M.RAW!$A:$A, 0)) >= OFFSET($B$8, 0, COLUMN() - COLUMN($B$10)),
/* 3) Upper shadow ≤ upper_shadow_max (B5) */
ABS(INDEX(M.RAW!$E:$E, MATCH($A11, M.RAW!$A:$A, 0)) - INDEX(M.RAW!$B:$B, MATCH($A11, M.RAW!$A:$A, 0))) / (INDEX(M.RAW!$C:$C, MATCH($A11, M.RAW!$A:$A, 0)) - INDEX(M.RAW!$D:$D, MATCH($A11, M.RAW!$A:$A, 0))) <= OFFSET($B$5, 0, COLUMN() - COLUMN($B$10)),
/* 4) Lower wick size ≤ lower_wick_max (B6) */
(INDEX(M.RAW!$C:$C, MATCH($A11, M.RAW!$A:$A, 0)) - MAX(INDEX(M.RAW!$B:$B, MATCH($A11, M.RAW!$A:$A, 0)), INDEX(M.RAW!$E:$E, MATCH($A11, M.RAW!$A:$A, 0)))) / (INDEX(M.RAW!$C:$C, MATCH($A11, M.RAW!$A:$A, 0)) - INDEX(M.RAW!$D:$D, MATCH($A11, M.RAW!$A:$A, 0))) <= OFFSET($B$6, 0, COLUMN() - COLUMN($B$10)),
/* 5) Wick-to-body ratio ≥ ratio_min (B7) */
(MIN(INDEX(M.RAW!$B:$B, MATCH($A11, M.RAW!$A:$A, 0)), INDEX(M.RAW!$E:$E, MATCH($A11, M.RAW!$A:$A, 0))) - INDEX(M.RAW!$D:$D, MATCH($A11, M.RAW!$A:$A, 0))) / (INDEX(M.RAW!$C:$C, MATCH($A11, M.RAW!$A:$A, 0)) - INDEX(M.RAW!$D:$D, MATCH($A11, M.RAW!$A:$A, 0))) >= OFFSET($B$7, 0, COLUMN() - COLUMN($B$10))
),
/* If all conditions met, output signal from B9 */
OFFSET($B$9, 0, COLUMN() - COLUMN($B$10)),
/* Otherwise, blank */
""
)

At the end of the day, AI may crank out code faster, but it still can’t appreciate the sweat equity behind each revision. Without a sense of time investment, a tiny tweak today can cascade into tomorrow’s breakdown. For now, AI remains a hyper-efficient apprentice, not a true partner. Last night, a two-hour session produced twenty minutes of solid work but also broke other dependencies I must now resolve, adding another two hours of real work.

Welcome to the Machine…
 
I spent the better part of last week ripping out the roots and rebuilding stats. I will no longer give anything a name until the entire project is done.
The cool sounding HexaSentinel went from 6 to 11 (have no idea what to call it now).

AI-BETH is fired, scrubbed her code she was an abrasive know it all, and failed to follow instructions, her replacement is Tess. All these AIs gotta be watched like a hawk. They screw up code constantly, slow me down, but at least I know how to find the broken FX. hardest part is they cannot maintain reference on columns rows and sheets. They also keep trying to add INDEX OFFSETs and anything else they can think of which I know aren't needed.

I've done 11 2-3 hours sessions just on 11 Pre-Conditional Gates and 11 single candlestick patterns.

The 11 Pre-Conditional Gates are like a tumbler lock, there are 2048 possible combinations, but you're not likely to see that many.

As for the 11 patterns, it's cool but not much value by it'self. I tried to apply some filters, but it choked the triggers.
Of 760 bars I have 806 patterns. This means I need to either assign a Tier-priority for some patterns or math out the differences so any single monthly bar can only contain 1 pattern.

Soon I'll be working the muti-pattern (think three white knights) that is going to melt my brain....
 
Another component of the CPDS (Contextual Pattern Detection System) is BARP.

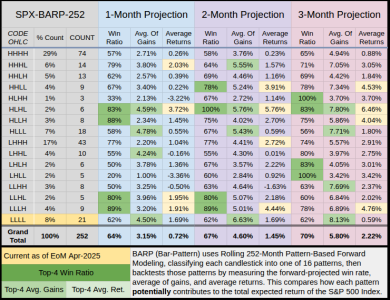
Stick around, I promise it'll be worth it. BARP is just a very simple BAR Pattern framework that assigns each candlestick bar a four-letter code based on whether its Open, High, Low and Close are higher (“H”) or lower (“L”) than the previous bar. This creates 16 distinct patterns you can backtest against. Thus we can estimate the Win Ratio, Average of Gains, Average of Losses and the Expected returns over (in this case) the 1, 2 and 3-month returns forward of the pattern.

To get anything out of BARP we need to have some form of context, in this example we'll use the Baseline returns of 780+ bars.
This tells us the dart-throwing blind monkey can expect to have a win ratio of 60-65% over 1-3 months.


With BARP we can sharpen the results. As an Example, April-2025 was a LLLL (upper left on the table). On the monthly scale this is the most common of the 16 patterns at a count of 264 months or 34% of 780+ months. But this is also a statistically higher pattern, with better returns and more occurrences. By better I mean better than the baseline we used for context.


But to measure this further we can use a weighted expected return table. This shows not just which patterns “win” on a per-trade basis, but which ones actually move the needle.
  • PctBars tells you frequency, patterns like LLLL (33.6 %) appear most often, while HLLH (<1 %) are rare.
  • ExpRet is the per-trade edge if you isolated that pattern over 1-3 months.
  • Impact = PctBars × ExpRet shows the pattern’s contribution to your total expected return.
As potentially with April-2025, a large positive impact (LLLL’s 1.01% at 1 Month) means it’s both common and profitable, so trading every LLLL signal yields roughly +1.01% of your capital over that horizon, just from that one setup. Conversely, a big negative impact flags patterns to avoid (HHHH at -.56%).
 
Last edited:
Another component of the CPDS (Contextual Pattern Detection System) is BARP.

As potentially with April-2025, a large positive impact (LLLL’s 1.01% at 1 Month) means it’s both common and profitable, so trading every LLLL signal yields roughly +1.01% of your capital over that horizon, just from that one setup. Conversely, a big negative impact flags patterns to avoid (HHHH at -.56%).

Update for BARP, the previously posted charts were removed, we had some bad data sorted.
The Baseline is the bottom row at Grand Total which shows the 21-Year (252-Month) averages.

April-2025 Closed at LLLL
  • 7th best of 16 patterns
  • Below Average projected win ratios
  • Top-4 of 16 best 1/2/3 month forward-projected gains (when we win)
  • A 21-Count of 252 is not large, but is the 3rd largest sample of data
Screenshot_2025-05-15_13-20-16.png


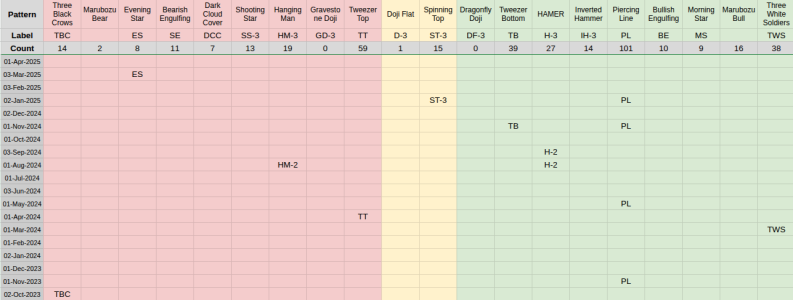
As for the rest of CPDS, I did a marathon session and got the Candlestick PDS built. I've successfully mapped out 20 1/2/3 Bar patterns, using 40+ unique attributes. This was the only way I could math out excessive pattern overlap. It would have been much easier to just prioritize the patterns where you have 2-3 in the same month, but I wanted more control and higher quality patterns.

For 752 bars we have 371 patterns, 49% but if we remove the 75 overlaps it's 28%, which is what we want, we want less patterns but more impact per pattern. This was the 3rd and hopefully final time I've rebuilt this from the ground up. But there is more to do here.
  • Match patterns to forward-projected returns.
  • Forward-weight patterns by time (last 252-months more relevant than all 750)
  • Assign patterns to the 11 Pre-Conditional Gates, (a real hammer pattern should be at the bottom of a trend)
  • Then Match Patterns + Pre-Conditional Gates to forward-projected returns.

    Screenshot_2025-05-15_13-36-02.png
 
The pain continues.

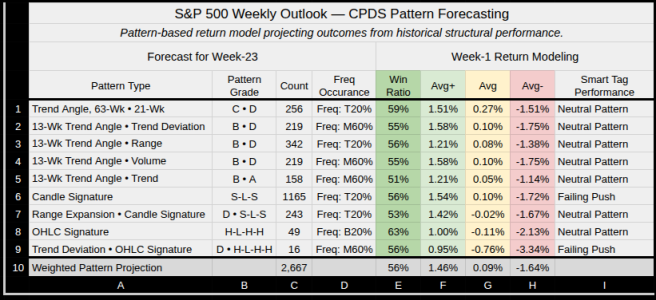
While grading various metrics, it became apparent, I could not properly grade years worth of data unless some of it (like Linear Regression Slopes) were graded in log scale. Visually speaking I detest log scale charts, but if I want to do this right within a data base then Log scale is the better choice. So much of the weekend was spent converting over to Log scale.

Technically the grading system is not needed, AI can evaluate the data, but if I want this system to be self-contained, then the rule-sets have to be created. Lots of tags per range of values.

Screenshot_2025-05-19_15-10-46.png
 
Yeah, not a fan log log scale unless it's a very long term chart and the early action is barely recognizable.
 
  • Like
Reactions: JTH
HAL-63 Monthly is making progress, the following sections are finished.
  1. Part 1: Macro Signals, Market Breadth & Correlation
  2. Part 2: Trend, Volatility, Momentum & Divergence
    • Match Statistics: Historical Precedent for Current
  3. Part 3: Seasonal & Pattern-Based Market Outlook
    • S&P 500 Performance Snapshot
    • S&P 500 Seasonality
    • BARP Open-High-Low-Close Bar Pattern Vs. Next Month’s Performance
    • Candlestick Pattern Detection
  4. Part 4: Probabilistic Outlook for May–July 2025

The hardest part is going to be both the position sizing and entry/exit decisions. I'll be honest, on the monthly timeframe you just can't make decisions based on monthly data. It's too slow, I've already determined it would be a waste of my energy to develop those metrics for the monthly scale.

It does serve as a good backdrop for a smaller timeframe. I will work on that once I get the Weekly database built. In the meantime, I'm working on getting the AI to write the blog and it's a challenge to get both a a good consistent evaluation of the stats, and an accurate Blog. Below is a sample, it's working with data up to Apr so it has no idea what's happened so far in May.

Part 4: Probabilistic Outlook for May–July 2025​


Macro Signals, Market Breadth & Correlation

Recent macro signals show moderate volatility and mixed market breadth. Correlation among major market segments remains stable but signals caution amid ongoing macro uncertainties.


Trend, Volatility, Momentum & Divergence (MARK Insights)

Trend remains positive but less steep, volatility is moderate indicating elevated uncertainty, momentum is weak suggesting limited upside, and divergence metrics show a clean but cautious setup.


Seasonal & Pattern-Based Market Outlook
  • May 2025:
    56.5% Win Ratio  0.19% Average Return  (Slightly lower)
  • June 2025:
    52.5% Win Ratio  0.83% Average Return  (Lower)
  • July 2025:
    56.5% Win Ratio  0.15% Average Return  (Slightly lower)
Risks & Conditions:
Macro headwinds, ongoing USD strength, and moderate volatility tracked in MARK could dampen gains. Recent seasonal underperformance and mixed technical patterns limit predictive confidence. Elevated volatility adds uncertainty.

Summary

Combining macro, technical, seasonal, and pattern signals, the outlook for May–July 2025 is cautiously optimistic with modest upside potential balanced against persistent risks.
 
Just popped in to take a look at this. I love it !!!! Very cool. Nice work man.......or Hal......or whoever you are......😂🤣

aHR0cDovL28uYW9sY2RuLmNvbS9oc3Mvc3RvcmFnZS9taWRhcy9jMGZmZGVmYzFmNzlhZjdkNWIzMDU0ZDRmZjc0ZTc0OC8yMDM2MDAyMTIvZ01IVHRJWXJhYkE2ay5naWY=


.
 
Just popped in to take a look at this. I love it !!!! Very cool. Nice work man.......or Hal......or whoever you are......😂🤣

aHR0cDovL28uYW9sY2RuLmNvbS9oc3Mvc3RvcmFnZS9taWRhcy9jMGZmZGVmYzFmNzlhZjdkNWIzMDU0ZDRmZjc0ZTc0OC8yMDM2MDAyMTIvZ01IVHRJWXJhYkE2ay5naWY=


.

Sometimes I feel like the Monkey.

Although HAL-63 Monthly should be finished, I added another component to the MACRO side. A Sector Sentiment Compass, that focuses on the rotations between the Tech/Utilities & Consumer Discretionary/Staples. Sort of a poor man's Rotation Indicator.
More specifically:
  • XLY/XLP compares Consumer Discretionary vs. Staples
    → Measures risk appetite vs. defensive posture
  • XLK/XLU compares Technology vs. Utilities
    → Tracks growth vs. yield-seeking safety

Some nights I go to bed and wake up realizing I've been dreaming about calculations.

The funny part I'm only using 3 indicators and volume.
  • But they are log-scaled, Z-scored, then sorted by 15 grades ranging A+ to F-
    Then there are 10-internal statuses like volume which are anchored to the direction of trend.
    • High Volume can have two different meanings, in a rising slope it may imply buying, with a declining slope selling.
    • So while you may have strong Volume with Grade A+ you also need the distinction of the direction.
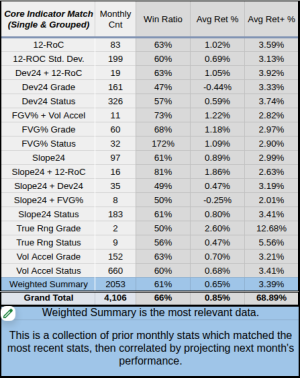
So anyhow because I'm able to tag all these conditions, it also means I can match current conditions with previous conditions. So for every monthly bar, there are 100+ possibilities, with only 750 months a perfect match is not likely. So I've created single indicator matches and some 2-Indicator matches. While the Grand Total below list 4,106 matches this is really just about 5% of the possible outcome.


Screenshot_2025-05-23_16-58-16.png
 
I think it's awesome man. I just don't have the mindset to do anything like that, so I'm always impressed with stuff like this.
I'm a blue collar guy. I like beating stuff with a hammer. That's my happy place...... I literally am that monkey🤣
Have a great weekend !!!
 
With HAL-63 Monthly complete, I've reached a fork in the road.
I've pushed Google Sheets to its limits, to the point that continuing to build on it would eventually hurt progress rather than help it.

Option A: Stay in Google Sheets, I could continue by building out the Weekly and Daily models, , add the live data feed, position sizing, and basic back-testing. But realistically, I know I've already hit a hard ceiling, Google Sheets just isn’t built for true quantitative work.

Option B: Transition to Python. The alternative is to take everything I’ve built and learned so far, and apply those lessons in Python. So I have to learn to code again. This path means learning a new skill from the ground up, but it also means I'll have a more powerful set of tools, much more scalable and and able to do serious quant which isn't reliant on an AI interface for output.

Anyhow, once May is closed out this weekend, I'll add the new data and see if any we can find any new clues.
 
Option B: Transition to Python. The alternative is to take everything I’ve built and learned so far, and apply those lessons in Python. So I have to learn to code again. This path means learning a new skill from the ground up, but it also means I'll have a more powerful set of tools, much more scalable and and able to do serious quant which isn't reliant on an AI interface for output.

The pain continues...

The Python Jupyter/Anaconda console is configured, and the data is synced with google cloud. I'm going to have to shelve it down the line, since I think I first need to finish the weekly/daily pattern detection system. Once that is done, then I can spend some time focusing on the machine-learning aspect.

So back to what I know, I've decided to cut out the monthly Trend, it was not valuable enough, so I'm doing a 13/21/63-Week 3-Trend system on the weekly, it gives 3K weeks of data, while not bogging down the spreadsheet the 16K of data on the Daily timeframe does.

I've also rebuilt the Pattern Detection System (4th time now) but it's much leaner and faster.
  • 16 patterns on the BARP
  • 12 patterns on a Composited Candlstick System
  • Combined this gives 192-single bar patterns (more then needed)
  • After anchoring these patterns to an over/under on 3 trends and with 3-deviations:
    • SIngle-Bar 1,728 combinations
    • Double-Bar nearly 3 million
    • Triple-Bar Over 5.1 billion
This is just the surface, because we also have monthly and daily data. Also it doesn't address the other indicators which will be contextually anchored to trend.

Of course this is way more data than is needed, so I will have to assign some form of priority to filter the best setups.
 
Last edited:
Back
Top