P&F Chart School

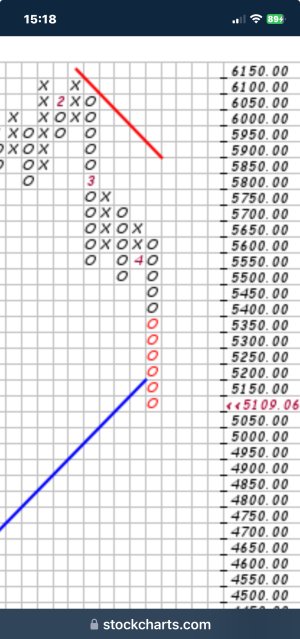
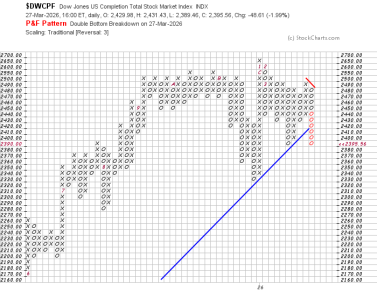
So- today the S&P500 busted through the blue line at 5200, and remains below. If it stays below past the close, I think we’re in for some real bad stuff ahead.

The triple bottom breakdown, and the continued softness here tells me no bounce back for at least another day, and more likely two. I think 5000 is a line of resistance, and if that doesn’t hold, the next resistance isn’t until around 4400.
Right now thinking 5000 will be the next couple of days. Then I hope it holds.

IMG_1675.png
 

Attachments

  • IMG_1676.jpeg
    IMG_1676.jpeg
    440.5 KB · Views: 8
Interesting breakout on the S fund yesterday- it’s now officially a “Quad Top Breakout”.

Bodes well for future growth.
 

Attachments

  • IMG_6058.jpeg
    IMG_6058.jpeg
    345.9 KB · Views: 4
  • IMG_6059.jpeg
    IMG_6059.jpeg
    295.2 KB · Views: 4
Interesting breakout on the S fund yesterday- it’s now officially a “Quad Top Breakout”.

Bodes well for future growth.

Nice find, that should place DWCPF's AI-estimated price target at:

Targets (P&F methods)
Horizontal (conservative)
Move = base width × box = 4 × 5 = 20 points.​
Target = 2,528.97 + 20 = 2,548.97.​
% gain ≈ +0.79%.​
Vertical (extended)
Move = (number of X boxes × box) × reversal = (5 × 5) × 3 = 75 points.​
Target = 2,528.97 + 75 = 2,603.97.​
% gain ≈ +2.97%.​
 
we had a double bottom breakdown today in the S fund.

chart for $DWCPF shows the P&F breakdown. Estimates another 50 points on the down side probable. This chart is saying to me that it’s going to try and fill in down to 2380 or so.

Today we are at 2434. There is a layer of light resistance here around 2420. Then another resistance point at 2390, and then a much more solid resistance around 2380.

That’s where resistance is likely to hold.

From http://stockcharts.com


IMG_0103.jpeg
 
Last edited:
Back
Top