[TABLE="class: tablewrapper"]
[TR]
[TD="class: econo-reportname, colspan: 2"]
EIA Petroleum Status Report
[/TD]
[/TR]
[TR]
[TD="colspan: 2"]
Economic Calendar - Bloomberg[more]
| | |
[TABLE="class: actual_consensus_box"]
[TR="class: actual_consensus_toprow"]
[TD] | Prior | Actual |
| Crude oil inventories (weekly change) | | |
| Gasoline (weekly change) | | |
| Distillates (weekly change) | | |
[TD="class: econo-releaseinfo"] Released On 4/27/2016 10:30:00 AM For wk4/22, 2016 [/TD]
[TD="class: actual_consensus_box_numbers"]2.1 M barrels[/TD]
[TD="class: actual_consensus_box_numbers"]
2.0 M barrels
[/TD]
[TD="class: actual_consensus_box_numbers"]-0.1 M barrels[/TD]
[TD="class: actual_consensus_box_numbers"]
1.6 M barrels
[/TD]
[TD="class: actual_consensus_box_numbers"]-3.6 M barrels[/TD]
[TD="class: actual_consensus_box_numbers"]
-1.7 M barrels
[/TD]
[/TD]
[/TR]
[/TABLE]
[/TD]
[/TR]
[TR]
[TD="colspan: 2"] Highlights
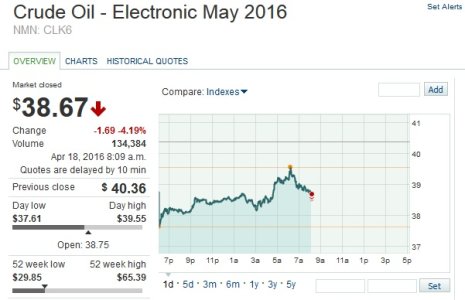
Oil inventories continue to build, up 2.0 million barrels in the April 22 week to another record, at 540.6 million. Product inventories are mixed with gasoline up 1.6 million barrels and distillates down 1.7 million. Refinery demand, which fell in the week, contributed to the build in oil as production of both gasoline and distillates declined. Refineries, however, may be boosting gasoline output in coming weeks based at least on the report's demand indications where gasoline is up a year-on-year 5.6 percent which is very strong for this reading. WTI, near $44.25, is down about 50 cents in initial reaction to the report.
[/TD]
[/TR]
[TR]
[TD="class: econo-defaultpara, colspan: 2"] Definition
The Energy Information Administration (EIA) provides weekly information on petroleum inventories in the U.S., whether produced here or abroad. The level of inventories helps determine prices for petroleum products.
Why Investors Care [/TD]
[/TR]
[TR]
[TD="colspan: 2"][/TD]
[/TR]
[TR]
[TD="class: econo-charts, colspan: 2, align: center"] [TABLE="class: econo-charts"]
[TR]
[TD]
[/TD]
[/TR]
[TR]
[TD] As is evident from the chart, crude oil stocks can fluctuate dramatically over the year. When oil prices nearly reached $50 per barrel in August 2004, financial market players began to monitor crude oil inventories. It is not surprising to see sharp price hikes in crude oil when inventories are falling. Conversely, one would expect price declines when inventories are rising.
Data Source: Haver Analytics[/TD]
[/TR]
[/TABLE]
[/TD]
[/TR]
[/TABLE]

