Oil Slick Stuff

[h=1]July Fourth gas prices to be highest since 2008[/h] Published June 29, 2014

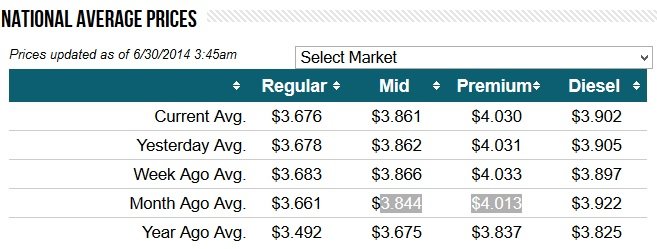
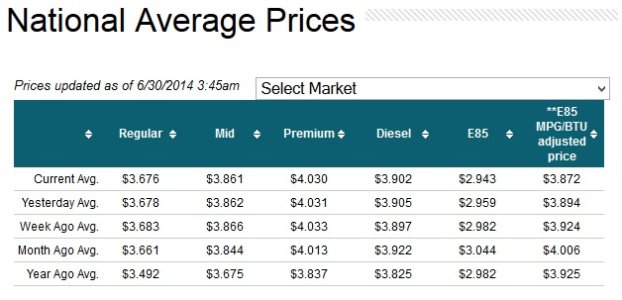
The recent spike in gas prices will make the July 4 holiday weekend the most expensive for drivers since 2008.
According to USA Today, prices will average $3.68 a gallon for regular-grade gas, up 17 cents from last year. That is still below the record price of $4.11 at the pump just after July 4, 2008.[more]
July Fourth gas prices to be highest since 2008 | Fox News
 
Reserves dropping you know what that means!
EIA Petroleum Status Report
[TABLE="class: actual_consensus_box"]
[TR="class: actual_consensus_toprow"]
[TD]
PriorActual
Crude oil inventories (weekly change)
Gasoline (weekly change)
Distillates (weekly change)

[TD="class: econo-releaseinfo"] Released On 7/2/2014 10:30:00 AM For wk6/27, 2014 [/TD]

[TD="class: actual_consensus_box_numbers"]1.7 M barrels[/TD]
[TD="class: actual_consensus_box_numbers"] -3.2 M barrels [/TD]

[TD="class: actual_consensus_box_numbers"]0.7 M barrels[/TD]
[TD="class: actual_consensus_box_numbers"] -1.2 M barrels [/TD]

[TD="class: actual_consensus_box_numbers"]1.2 M barrels[/TD]
[TD="class: actual_consensus_box_numbers"] 1.0 M barrels [/TD]
[/TD]
[/TR]
[/TABLE]
Economic Calendar - Bloomberg
 
Way too high! There is plenty of oil in the USA and Canada they are exporting it to the world to make MORE MONEY! Who is approving the changes in exporting American OIL? Guess!
 
Last edited:
Only in my dreams still $3.33 here and I have to go to the Atlanta Airport Wednesday and pick up the Wife! She's finally coming back, it's been 2 Months!
 
Why is this?:confused: Ha! you already know.:cool:
EIA: Federal Lands Contributing Less to Total US Energy Picture


by Gene Lockard
|
Rigzone Staff
|
Monday, July 07, 2014


Despite strong total U.S. oil and gas production figures overall in fiscal year (FY) 2013, the sales volume of combined fossil fuels recovered on federal and Indian lands fell by 7 percent last year, compared with figures for FY 2012, the Energy Information Administration (EIA) said in a recent report.
Crude oil volumes were actually up in FY 2013 from year-earlier figures. However, the drop-off reflected a drop in other fossil fuels, including coal, natural gas and natural gas plant liquids (NGPLs), the July 7 report said.
The decline was the latest in a succession of declines on federal and Indian lands that have occurred since 2003. Combined offshore and onshore natural gas figures on federal lands in 2003 were about 35 percent of the total U.S. natural gas production, but by 2013, they were just over 15 percent of the total.
The drop in the total contribution of natural gas recovered from federal lands since 2003 came because the general increase in onshore natural gas production on federal lands during that time failed to offset a drop in recoveries offshore during the same time period.
In 2007, rising gas production on federal lands in sales volumes overtook a general decline in offshore production, the EIA said.
- See more at: RIGZONE - EIA: Federal Lands Contributing Less to Total US Energy Picture
 
Oil inventories keep going down and Gas keeps going DOWN, Does NOT compute!:cool:
EIA Petroleum Status Report
Economic Calendar - Bloomberg
[TABLE="class: actual_consensus_box"]
[TR="class: actual_consensus_toprow"]
[TD]
PriorActual
Crude oil inventories (weekly change)
Gasoline (weekly change)
Distillates (weekly change)

[TD="class: econo-releaseinfo"] Released On 7/9/2014 10:30:00 AM For wk7/4, 2014 [/TD]

[TD="class: actual_consensus_box_numbers"]-3.2 M barrels[/TD]
[TD="class: actual_consensus_box_numbers"] -2.4 M barrels
[/TD]

[TD="class: actual_consensus_box_numbers"]-1.2 M barrels[/TD]
[TD="class: actual_consensus_box_numbers"] 0.6 M barrels [/TD]

[TD="class: actual_consensus_box_numbers"]1.0 M barrels[/TD]
[TD="class: actual_consensus_box_numbers"] 0.2 M barrels
[/TD]
[/TD]
[/TR]
[/TABLE]
 
Oil inventories keep going down and Gas keeps going DOWN, Does NOT compute!:cool:
EIA Petroleum Status Report
Economic Calendar - Bloomberg

[TABLE="class: actual_consensus_box"]
[TR="class: actual_consensus_toprow"]
[TD]
Prior
Actual
Crude oil inventories (weekly change)
Gasoline (weekly change)
Distillates (weekly change)

[TD="class: econo-releaseinfo"]Released On 7/9/2014 10:30:00 AM For wk7/4, 2014
[/TD]

[TD="class: actual_consensus_box_numbers"]-3.2 M barrels
[/TD]
[TD="class: actual_consensus_box_numbers"] -2.4 M barrels
[/TD]

[TD="class: actual_consensus_box_numbers"]-1.2 M barrels
[/TD]
[TD="class: actual_consensus_box_numbers"] 0.6 M barrels
[/TD]

[TD="class: actual_consensus_box_numbers"]1.0 M barrels
[/TD]
[TD="class: actual_consensus_box_numbers"] 0.2 M barrels
[/TD]
[/TD]
[/TR]
[/TABLE]

Cheney's fault. I was going to go with Bush's fault, but Cheney was the one with ties to Halliburton.:cheesy:
 
Back
Top