It was a choppy day of trading with the major averages spending the bulk of the trading session below the neutral line. The biggest move of the day came just after 10:30 a.m. EST when news of another earthquake in Japan hit the wires and spiked the averages moderately lower. But it didn't take long for the broader market to find a bottom and by the close the market managed to post only modest losses overall.
In economic news, the European Central Bank hiked lending rates for the first time since mid-2008. Their key lending rate now sits at 1.25%.
Both the Bank of England and the Bank of Japan, who had meetings of their own, kept their target rates unchanged.
Oil prices hit another two-year high today, closing at $110.30 per barrel. That means oil has risen more than 20% since the beginning of the year.
On the domestic economic data front, the latest jobless claims data totaled 382,000, which was down 10,000 from the previous week and only slightly less than the 386,000 initial claims that had been expected. Continuing claims dipped modestly to 3.72 million after last week's reading of 3.73 million.
Here's the charts:

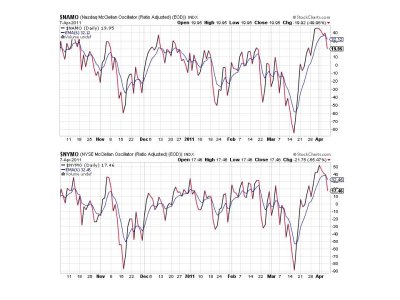
NAMO and NYMO both fell harder than I would have expected today and could be foretelling a bigger decline ahead. But I can't embrace that outlook after one day of weakness. They are flashing sells nonetheless.

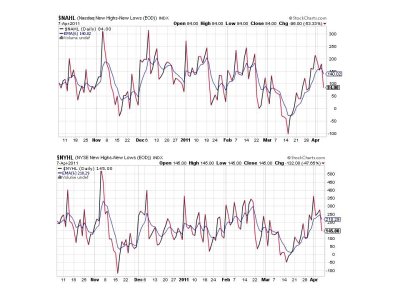
NAHL and NYHL are also now flashing sells.

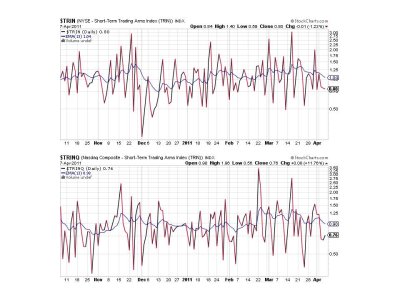
TRIN and TRINQ remained in a buy condition.

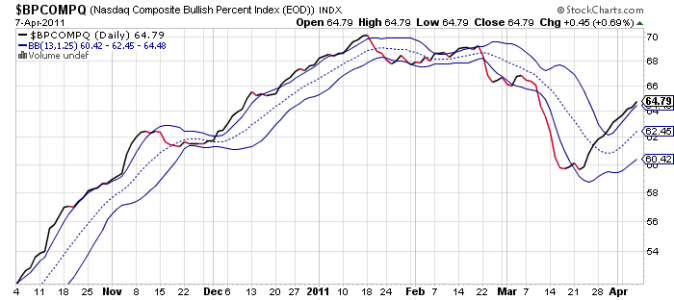
BPCOMPQ actually ebbed a bit higher today and remains on a buy.
So 3 of 7 signals remain on buys, which keeps the Seven Sentinels in a buy condition.
I'm not surprised by the weakness today, and I'm thinking this is another buying opportunity for those who want to go long. The weakness may not be over, but it's hard to see the market giving back too much more given (guess what) liquidity.
In response to a question I was asked about what liquidity means in layman terms. Here's a good commentary on POMO, but it's from last November so it's mixed with market data from that time frame. However, you can skip to about the 7 minute mark to get directly into the POMO explanation.
http://www.youtube.com/watch?v=_ezRlDT5LkQ&feature=related
In economic news, the European Central Bank hiked lending rates for the first time since mid-2008. Their key lending rate now sits at 1.25%.
Both the Bank of England and the Bank of Japan, who had meetings of their own, kept their target rates unchanged.
Oil prices hit another two-year high today, closing at $110.30 per barrel. That means oil has risen more than 20% since the beginning of the year.
On the domestic economic data front, the latest jobless claims data totaled 382,000, which was down 10,000 from the previous week and only slightly less than the 386,000 initial claims that had been expected. Continuing claims dipped modestly to 3.72 million after last week's reading of 3.73 million.
Here's the charts:

NAMO and NYMO both fell harder than I would have expected today and could be foretelling a bigger decline ahead. But I can't embrace that outlook after one day of weakness. They are flashing sells nonetheless.

NAHL and NYHL are also now flashing sells.

TRIN and TRINQ remained in a buy condition.

BPCOMPQ actually ebbed a bit higher today and remains on a buy.
So 3 of 7 signals remain on buys, which keeps the Seven Sentinels in a buy condition.
I'm not surprised by the weakness today, and I'm thinking this is another buying opportunity for those who want to go long. The weakness may not be over, but it's hard to see the market giving back too much more given (guess what) liquidity.
In response to a question I was asked about what liquidity means in layman terms. Here's a good commentary on POMO, but it's from last November so it's mixed with market data from that time frame. However, you can skip to about the 7 minute mark to get directly into the POMO explanation.
http://www.youtube.com/watch?v=_ezRlDT5LkQ&feature=related
