Summary: IFT-Cutoff % Performance vs. the session close is statistically the most reliable, followed by opening gaps. Combined, the two are stronger together (more so for buyers on the downside). The two stats go against each other 28% of the time, but when they do, the gains & losses look to be relatively flat. If undecided, the best choice is to do nothing, or go with the direction of the IFT-Cutoff (if it is positive).
From Tom's Commentary
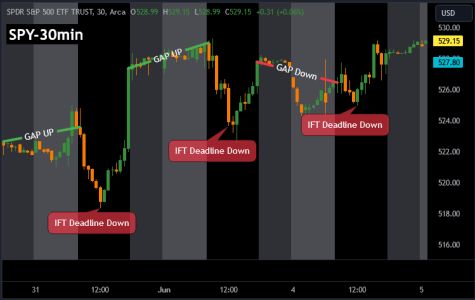
"Not that this helps or hurts our analysis, but I put this under the hmmm, category. For the last three trading days, stocks moved lower in the morning, bottomed between 12 noon and 1 PM ET, and then rallied into the close."
Here's what this looks like on the SPY 30-minute chart which also gives us the pre/post market data, allowing us to see the opening gaps. What's noticeable, is the shifting price action. When we see price reversals this is not our norm, but it is also fair to say this isn't outside the scope of statistical probabilities.
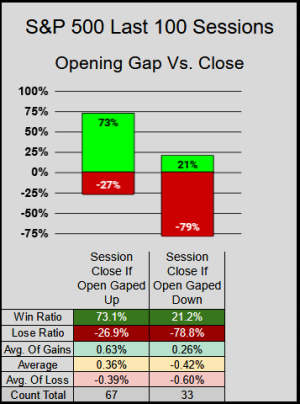
Case in point, from the last 100 sessions:
When the Index gaped up at the open, the session closed up 73% of the time.
When the Index gaped down at the open, the session closed down 79% of the time.
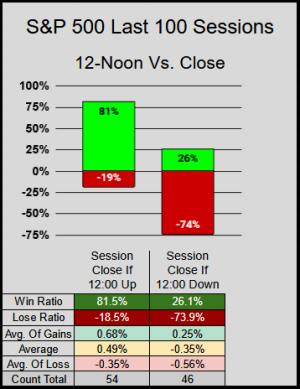
Looking at the 12-Noon Close (our IFT-Cutoff)
When 12:00 was positive, the session closed up 81% of the time.
When 12:00 was negative, the session closed down 74% of the time.
Now lets combine both Gaps and the 12:00 IFT-Cutoff
When the Gap & IFT-Cutoff were positive, the session closed up 83% of the time.
When the Gap & IFT-Cutoff were negative, the session closed down 92% of the time.
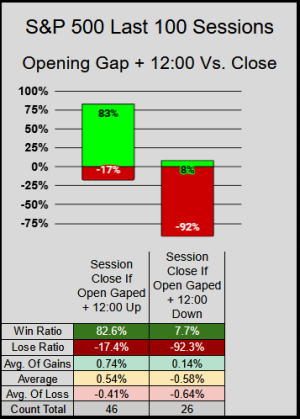
But.... These same-direction combinations only happened the last 72 of 100 sessions.
Digging into what falls outside the scope of normal, lets look at those 28 abnormal sessions.
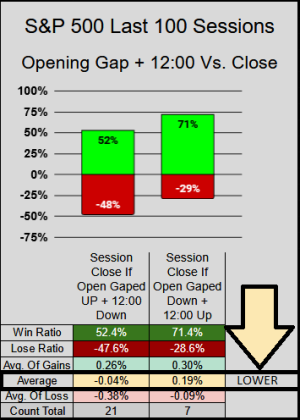
When the Index gaped up, but 12:00 was down, the session closed up 52% of the time (dead stat).
When the Index gaped down, but 12:00 was up, the session closed up 71% of the time (acceptable).
One last key point (if you go back and look at the average returns for each chart) you will see this chart has the lowest average, thus this might imply on days where the gap/12:00 stats don't align, we are more likely to have a flatter close.
From Tom's Commentary
"Not that this helps or hurts our analysis, but I put this under the hmmm, category. For the last three trading days, stocks moved lower in the morning, bottomed between 12 noon and 1 PM ET, and then rallied into the close."
Here's what this looks like on the SPY 30-minute chart which also gives us the pre/post market data, allowing us to see the opening gaps. What's noticeable, is the shifting price action. When we see price reversals this is not our norm, but it is also fair to say this isn't outside the scope of statistical probabilities.

Case in point, from the last 100 sessions:
When the Index gaped up at the open, the session closed up 73% of the time.
When the Index gaped down at the open, the session closed down 79% of the time.

Looking at the 12-Noon Close (our IFT-Cutoff)
When 12:00 was positive, the session closed up 81% of the time.
When 12:00 was negative, the session closed down 74% of the time.

Now lets combine both Gaps and the 12:00 IFT-Cutoff
When the Gap & IFT-Cutoff were positive, the session closed up 83% of the time.
When the Gap & IFT-Cutoff were negative, the session closed down 92% of the time.

But.... These same-direction combinations only happened the last 72 of 100 sessions.
Digging into what falls outside the scope of normal, lets look at those 28 abnormal sessions.
When the Index gaped up, but 12:00 was down, the session closed up 52% of the time (dead stat).
When the Index gaped down, but 12:00 was up, the session closed up 71% of the time (acceptable).
One last key point (if you go back and look at the average returns for each chart) you will see this chart has the lowest average, thus this might imply on days where the gap/12:00 stats don't align, we are more likely to have a flatter close.

