I'm running behind this evening so I'm going to go straight to the charts tonight.

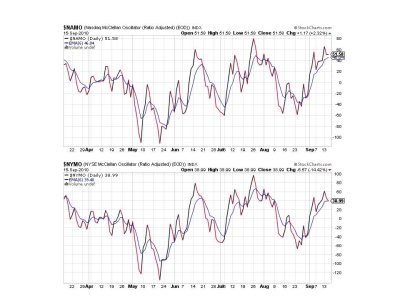
NAMO and NYMO are hanging in there, but the momentum has definitely subsided. NYMO is sitting right on its 6 day EMA. Of particular note though is that the 6 day EMA signal on both charts shows that the EMA is close to a multi-month high. That could be problematic in a market that likes to turn on a dime. My thought is we make one more run higher before we turn it down, but that's only a gut call.

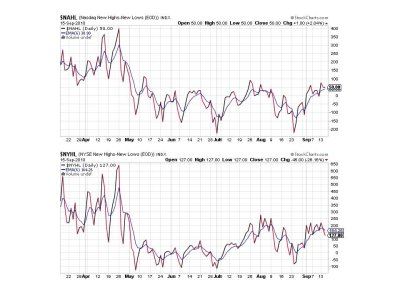
NAHL remains on a buy, but NYHL has flipped to a sell. These two signals are not bearish, but could be signaling some selling pressure is coming within next few trading days.

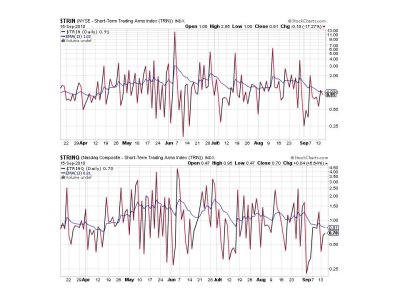
TRIN and TRINQ remain on buys. But the 13 day EMA signal on both charts shows it is near multi-month lows. This could also be suggesting selling pressure is near.

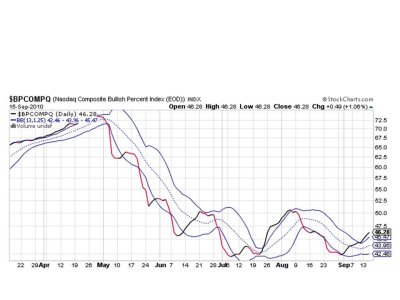
BPCOMPQ looks good, but it's still not ramping up quickly.
So we have 6 of 7 signals on buys, but the signals themselves can roll over quickly given enough selling pressure. If that happens and a sell signal is produced, the 28 day trading low for NYMO would be needed to validate the signal and that's quite a ways off.
Having said that however, the sentinels went to a buy this last time well before NYMO's 28 day trading high was hit. So in this last case using the 28 day trading high delayed getting invested when the market was in a sustained move higher. The danger though is getting whipsawed by false signals, which can certainly happen in this market.
You may want to consider whether you personally want to use that 28 day trading high (or low) in each case the SS flashes a new signal. Considering how bearish sentiment was on this last buy signal, a contrarian might have entered the market without it. And considering where the EMAs are right now a sell signal may need to be heeded sooner rather than later. Just some food for thought.

NAMO and NYMO are hanging in there, but the momentum has definitely subsided. NYMO is sitting right on its 6 day EMA. Of particular note though is that the 6 day EMA signal on both charts shows that the EMA is close to a multi-month high. That could be problematic in a market that likes to turn on a dime. My thought is we make one more run higher before we turn it down, but that's only a gut call.

NAHL remains on a buy, but NYHL has flipped to a sell. These two signals are not bearish, but could be signaling some selling pressure is coming within next few trading days.

TRIN and TRINQ remain on buys. But the 13 day EMA signal on both charts shows it is near multi-month lows. This could also be suggesting selling pressure is near.

BPCOMPQ looks good, but it's still not ramping up quickly.
So we have 6 of 7 signals on buys, but the signals themselves can roll over quickly given enough selling pressure. If that happens and a sell signal is produced, the 28 day trading low for NYMO would be needed to validate the signal and that's quite a ways off.
Having said that however, the sentinels went to a buy this last time well before NYMO's 28 day trading high was hit. So in this last case using the 28 day trading high delayed getting invested when the market was in a sustained move higher. The danger though is getting whipsawed by false signals, which can certainly happen in this market.
You may want to consider whether you personally want to use that 28 day trading high (or low) in each case the SS flashes a new signal. Considering how bearish sentiment was on this last buy signal, a contrarian might have entered the market without it. And considering where the EMAs are right now a sell signal may need to be heeded sooner rather than later. Just some food for thought.
