I was not able to post my blog yesterday as the site was down for maintenance. I am providing a bit of commentary this morning, but without charts (I'll try to add them later this evening).
First, the Top 50 reduced their overall stock exposure by more than 17% going into this week's trading. That kind of reading has typically seen the market rally (on a weekly basis) when the Top 50 reduce stock exposure by more than 10% (in a bull market). But there are no shortage of technical indicators that have or are in the process of rolling over to sell conditions and seasonality is negative to boot. Yes, the Fed is currently supporting price, but that can change quickly. In fact, last week saw liquidity levels fall off their extreme (high) readings, but it does remain in moderately high expansion nonetheless.
I'm anticipating more volatility as a result of deteriorating technical indicators, fluctuating liquidity and bearish (bullish) sentiment.
Edit: As I mentioned above, I'm posting the charts Monday evening.
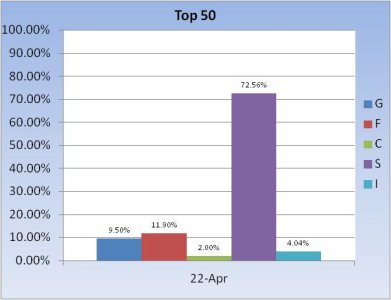
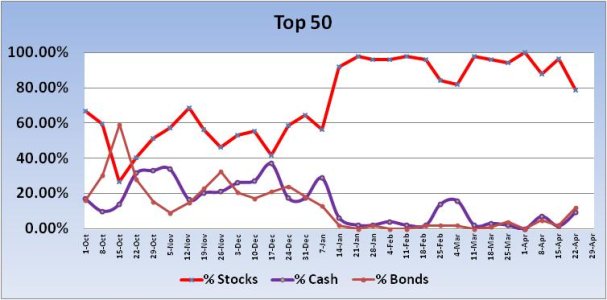
As you can see, the Top 50 reduced stock exposure by 17.9%. That's been a fairly reliable buy signal for more than a year now.
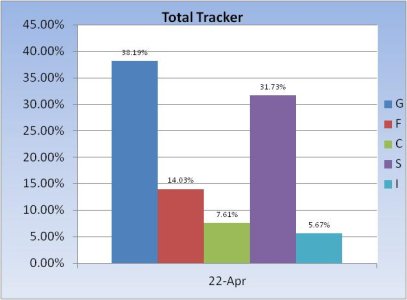
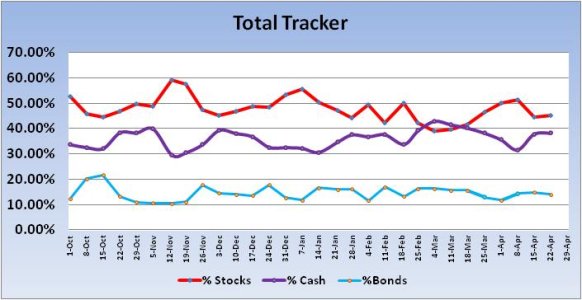
The Total Tracker saw only a modest change to total allocations as stock exposure rose by 0.59%.
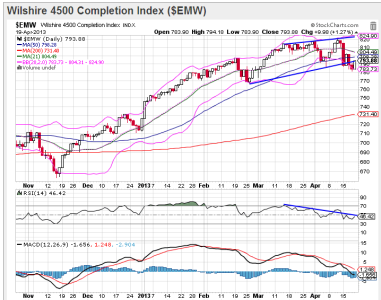
Along with a Top 50 buy signal, the chart of the S&P 500 also suggests we may be ready for at least a short term up leg as price bounced off the lower bollinger band on Friday and extended that bounce into Monday. I am a bit concerned with the longer term decline in RSI and MACD. They're bouncing at the moment, but how much bounce will we see? I'm thinking at least to the center of the bollinger bands, which is also around the 21 dma. I'm not particularly bullish beyond that short term expectation, but we'll see how it plays out.
First, the Top 50 reduced their overall stock exposure by more than 17% going into this week's trading. That kind of reading has typically seen the market rally (on a weekly basis) when the Top 50 reduce stock exposure by more than 10% (in a bull market). But there are no shortage of technical indicators that have or are in the process of rolling over to sell conditions and seasonality is negative to boot. Yes, the Fed is currently supporting price, but that can change quickly. In fact, last week saw liquidity levels fall off their extreme (high) readings, but it does remain in moderately high expansion nonetheless.
I'm anticipating more volatility as a result of deteriorating technical indicators, fluctuating liquidity and bearish (bullish) sentiment.
Edit: As I mentioned above, I'm posting the charts Monday evening.


As you can see, the Top 50 reduced stock exposure by 17.9%. That's been a fairly reliable buy signal for more than a year now.


The Total Tracker saw only a modest change to total allocations as stock exposure rose by 0.59%.

Along with a Top 50 buy signal, the chart of the S&P 500 also suggests we may be ready for at least a short term up leg as price bounced off the lower bollinger band on Friday and extended that bounce into Monday. I am a bit concerned with the longer term decline in RSI and MACD. They're bouncing at the moment, but how much bounce will we see? I'm thinking at least to the center of the bollinger bands, which is also around the 21 dma. I'm not particularly bullish beyond that short term expectation, but we'll see how it plays out.
