Our sentiment survey was decidedly bullish for the coming week, which kept the system in a sell condition. And both groups reflect that sentiment.
Here's the charts:


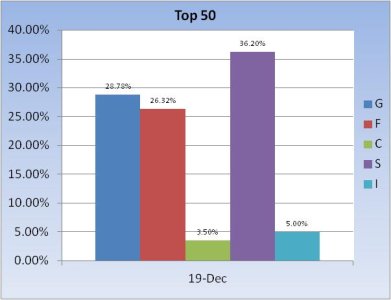
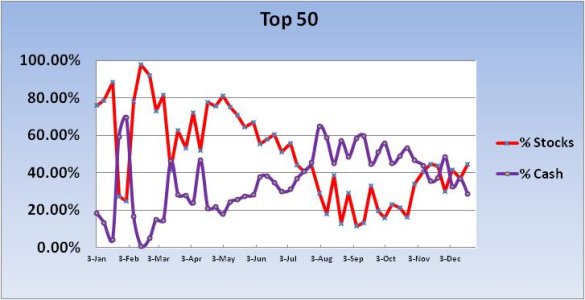
The Top 50 increased their allocation by 7.74%. So it appears they are buying the dip and hoping seasonality takes this market higher in the end of the year. This group still remains below a total 50% stock allocation. The last week this group had more than a 50% stock position was the week of July 5th. More than 5 months ago.


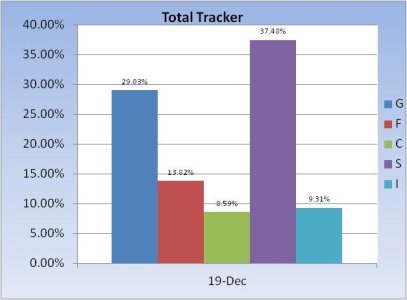
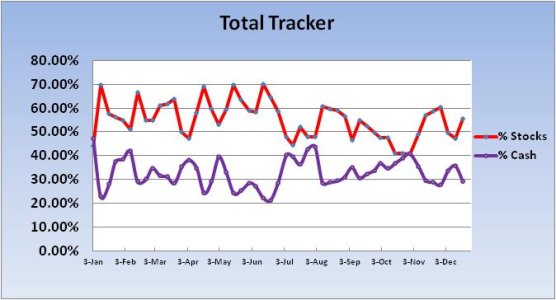
The herd increased their stock exposure by a 8.25%. So we're bullish, but not over-the-top bullish. At least not for December.
So we closed the previous week with back-to-back gains as OPEX came to a close, although Friday closed well off its highs of the day. I'm expecting more volatility, but I'm hoping the bias is higher. The Seven Sentinels do remain on a sell, but it's not far off from triggering another unofficial buy signal if the market can rally early next week.
Here's the charts:


The Top 50 increased their allocation by 7.74%. So it appears they are buying the dip and hoping seasonality takes this market higher in the end of the year. This group still remains below a total 50% stock allocation. The last week this group had more than a 50% stock position was the week of July 5th. More than 5 months ago.


The herd increased their stock exposure by a 8.25%. So we're bullish, but not over-the-top bullish. At least not for December.
So we closed the previous week with back-to-back gains as OPEX came to a close, although Friday closed well off its highs of the day. I'm expecting more volatility, but I'm hoping the bias is higher. The Seven Sentinels do remain on a sell, but it's not far off from triggering another unofficial buy signal if the market can rally early next week.
