-
The Forum works well on MOBILE devices without an app: Just go to: https://forum.tsptalk.com
-
Please read our AutoTracker policy on the IFT deadline and remaining active. Thanks!
-
$ - Premium Service Content (Info) | AutoTracker Monthly Winners | Is Gmail et al, Blocking Our emails?
Find us on: Facebook & X | Posting Copyrighted Material
-
Join the TSP Talk AutoTracker: How to Get Started | Login | Main AutoTracker Page
You are using an out of date browser. It may not display this or other websites correctly.
You should upgrade or use an alternative browser.
You should upgrade or use an alternative browser.
JTH's Account Talk
- Thread starter JTH
- Start date
JTH
TSP Legend
- Reaction score
- 1,158
Nice chart JTH. That cycle in fact goes all the way back to the 4800 top. Last weekend I was playing around with 130-minute bars in TradeStation, which results in three bars per 6.5-hour trading day. I looked at the precise highs and lows since the all-time high at about 4800, and found a clear pattern. There was essentially a double top with highs for the S&P 500 on 12/30/21 (1[SUP]st[/SUP] bar of the day), and 1/4/22. I chose to start with the first high on the morning of 12/30/21, and zoomed in and counted the following number of bars to each high and low in 2022…
View attachment 56678
Good morning
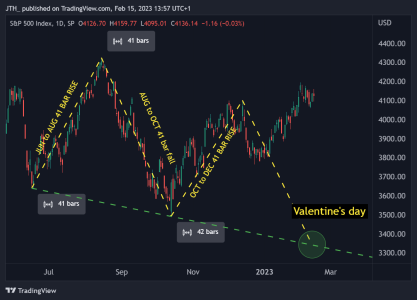
Symmetry works, until it doesn't. Here we show the S&P 500's 41 bar rise, 41 bar fall, & 42 bar rise. This price projection would entertain a breach of the October low, followed by a bounce off the box of chocolates.
View attachment 56677
Truncated quotes from 21-Dec 2022, so I guess this projection didn't materialize, but it was still a nice looking pattern.
- Reaction score
- 821
Post 2
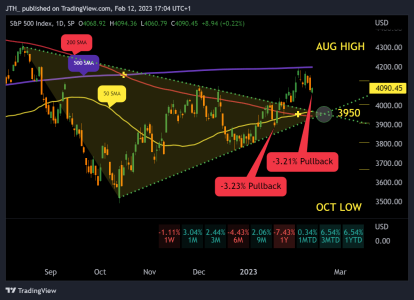
This Friday, time-wise we will reach the apex of the triangle, price-wise, we'd need to drop -4% in 3 days to reach 3950.
The way this market is jumping around it's possible but hopefully not likely. So far this month we have had a 2 day drop of 2.52% and a 3 day drop of 2.87%. On the plus side the first two days of February gave us a jump of 3.89% and if you add the last day of January that would be a 3 day rise of 5.27%. Hang onto your hat it's a crazy ride for sure. Sticky pants on and depends on standby. Good luck everyone.
JTH
TSP Legend
- Reaction score
- 1,158
Re: Sunday: Bears take the lead
Good morning
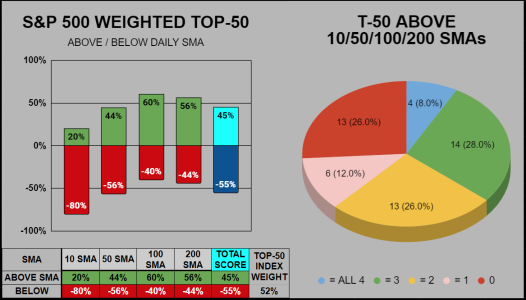
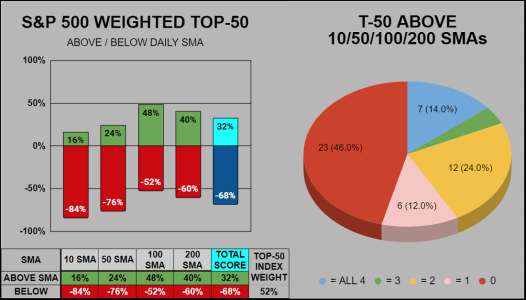
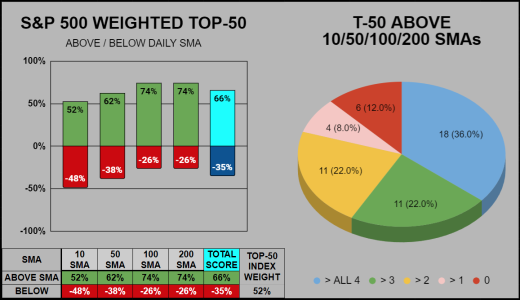
I don't typically track the 10 & 100 SMAs, but this is what's offered on Seeking Alpha, so for the purpose of time-management, it's quick work to produce this chart. There's nothing significant to report, the Top-50 have 18 trading above all four SMAs (Blue Pie), while 6 are trading below all four (Red Pie).

JTH
TSP Legend
- Reaction score
- 1,158
Re: Sunday: Bears take the lead
Good morning
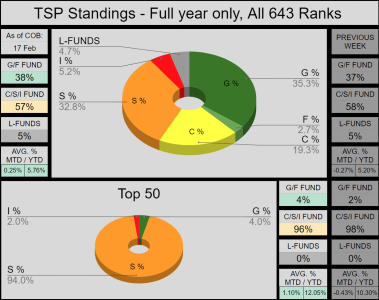
Across the Auto Tracker, overall allocations are relatively the same. As usual, the Top-50 are mostly embedded in the S-fund and amazingly have an average 12.05% YTD performance.
__
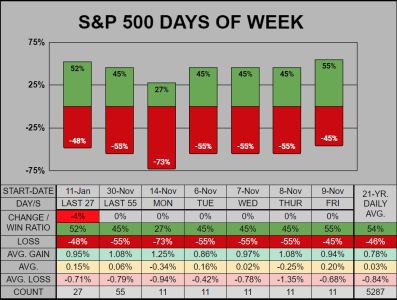
For the Day of Week chart, the win ratios have moved little and are still below the 21-year 54% daily average win ratio. The past 7 of 11 days have closed down, so in the short-term we have a 36% win ratio.
___
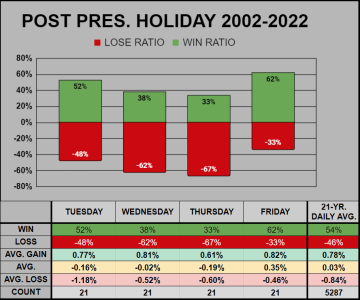
Once again, I forgot about the Holiday weekend until it crept up on me. From the previous 21-years, we can see Tuesday is average, Wed/Thur were weak, and Friday looked strong.
___
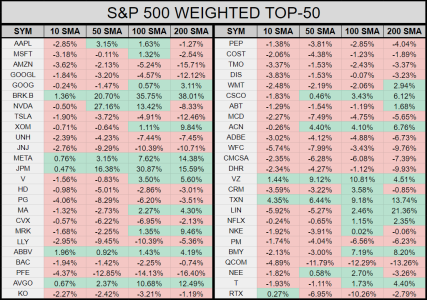
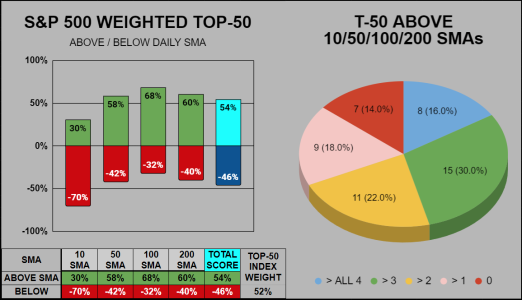
For the S&P 500's weighted Top-50, the short-term 10-SMA is weak, while the 50/100/200 SMAs look good. On the pie chart, 30% are trading above all four SMAs, while 16% are trading below all four SMAs.
___
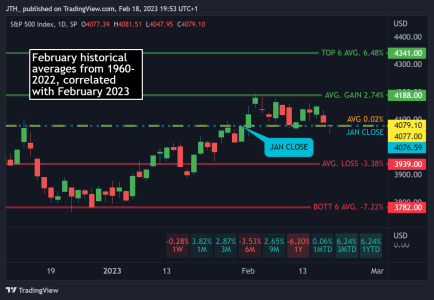
Current price (correlated with it's historical 63-year average) is right on target with the total .02% average of February closes combined.
Good morning
Across the Auto Tracker, overall allocations are relatively the same. As usual, the Top-50 are mostly embedded in the S-fund and amazingly have an average 12.05% YTD performance.

__
For the Day of Week chart, the win ratios have moved little and are still below the 21-year 54% daily average win ratio. The past 7 of 11 days have closed down, so in the short-term we have a 36% win ratio.

___
Once again, I forgot about the Holiday weekend until it crept up on me. From the previous 21-years, we can see Tuesday is average, Wed/Thur were weak, and Friday looked strong.

___
For the S&P 500's weighted Top-50, the short-term 10-SMA is weak, while the 50/100/200 SMAs look good. On the pie chart, 30% are trading above all four SMAs, while 16% are trading below all four SMAs.

___
Current price (correlated with it's historical 63-year average) is right on target with the total .02% average of February closes combined.

JTH
TSP Legend
- Reaction score
- 1,158
Re: Sunday: Bears take the lead
Correction: 16% are trading above all four SMAs, while 14% are trading below all four SMAs.
For the S&P 500's weighted Top-50, the short-term 10-SMA is weak, while the 50/100/200 SMAs look good. On the pie chart, 30% are trading above all four SMAs, while 16% are trading below all four SMAs.
Correction: 16% are trading above all four SMAs, while 14% are trading below all four SMAs.
JTH
TSP Legend
- Reaction score
- 1,158
Re: Sunday: Bears take the lead
Good morning
Off the 2-Feb top, we've pulled back -4.77%. So the question is, are we getting short-term oversold or are we in the beginnings of a deeper decline?
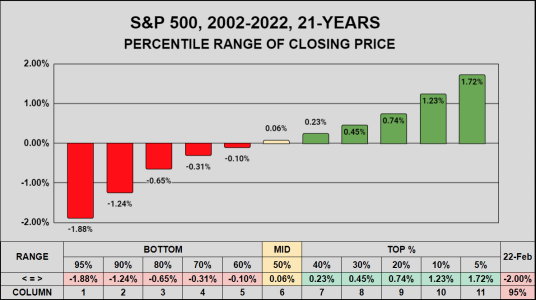
Monday the S&P 500 closed down -2.00%
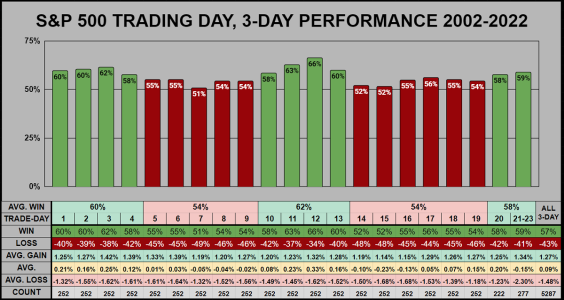
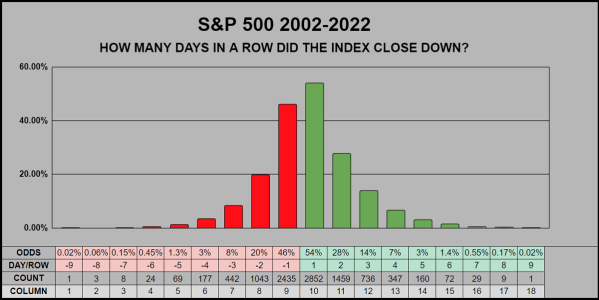
From 2002-2022, -2.00% ranks 239th of 5,287 days, this places it in the bottom 95% of the entire percentile range. On the chart below, this would be in the range of Column 1.
___
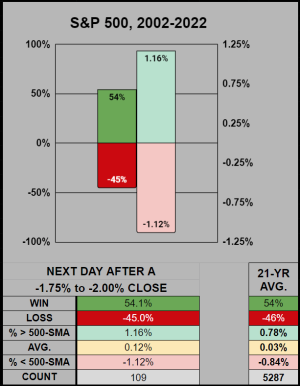
From 2002-2022, there were 109 days which fell within a range of -1.75% to -2.25%
Of those 109 days, the next day's close had a 54% win ratio (on par with the 21-Yr Avg.)
___
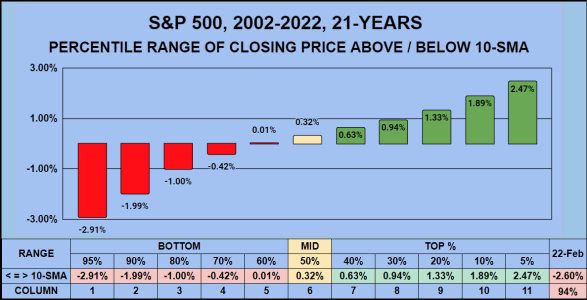
Lastly, on Monday the S&P 500 closed -2.60% below its 10-SMA. When compared with the previous 21-years, a -2.60% close falls within the bottom 94% in column 2.
Good morning
Off the 2-Feb top, we've pulled back -4.77%. So the question is, are we getting short-term oversold or are we in the beginnings of a deeper decline?
Monday the S&P 500 closed down -2.00%
From 2002-2022, -2.00% ranks 239th of 5,287 days, this places it in the bottom 95% of the entire percentile range. On the chart below, this would be in the range of Column 1.

___
From 2002-2022, there were 109 days which fell within a range of -1.75% to -2.25%
Of those 109 days, the next day's close had a 54% win ratio (on par with the 21-Yr Avg.)

___
Lastly, on Monday the S&P 500 closed -2.60% below its 10-SMA. When compared with the previous 21-years, a -2.60% close falls within the bottom 94% in column 2.

JTH
TSP Legend
- Reaction score
- 1,158
JTH
TSP Legend
- Reaction score
- 1,158
Re: Sunday: Small pullback
Good morning
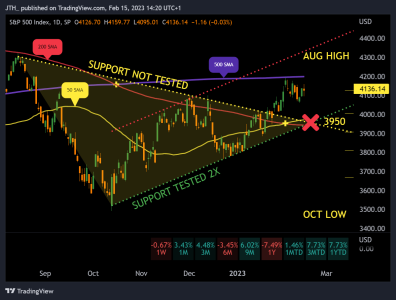
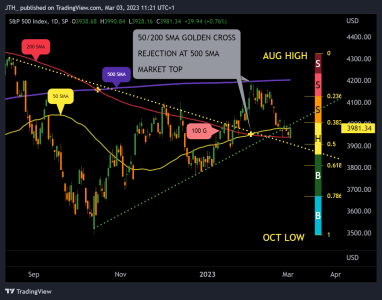
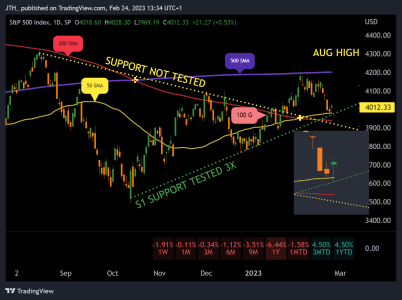
So it looks like on Wednesday buyers stepped in on the 50-SMA, then on Thursday they stepped in on the S1 Support line. Given the futures have looked down this morning, I suppose we can expect a breach of support. The 200-SMA is at 3940, about -1.8% below current price...
Good morning
So it looks like on Wednesday buyers stepped in on the 50-SMA, then on Thursday they stepped in on the S1 Support line. Given the futures have looked down this morning, I suppose we can expect a breach of support. The 200-SMA is at 3940, about -1.8% below current price...

JTH
TSP Legend
- Reaction score
- 1,158
JTH
TSP Legend
- Reaction score
- 1,158
Good morning
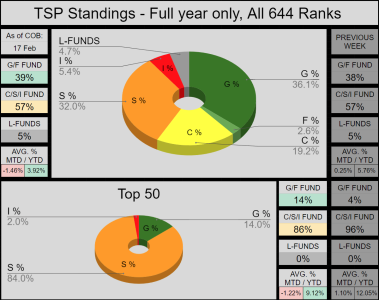
There's little allocation movement on the TSP AutoTracker, last week participants lost 1.84% YTD, while the Top-50 remains largely in the S-Fund, with this group losing 2.93% YTD.
____
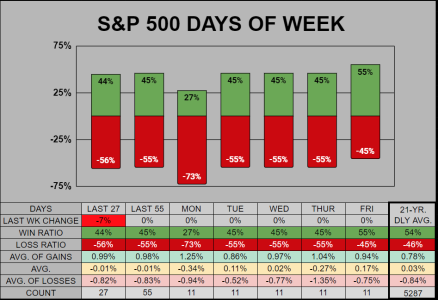
The Day of Week stats are also largely unchanged, we are still trading under the 21-Year 54% daily win ratio. The last 2 Tuesday/Fridays have closed down. The last 7 of 11 days closed down.
___
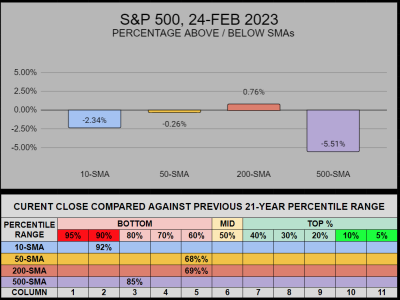
On the S&P 500, price is under the 10-SMA by -2.34%, this is in the bottom 92% percentile range.
___
The S&P 500's weighted Top-50 has lost some momentum, with only 4 of 50 stocks trading above the 10-SMA.
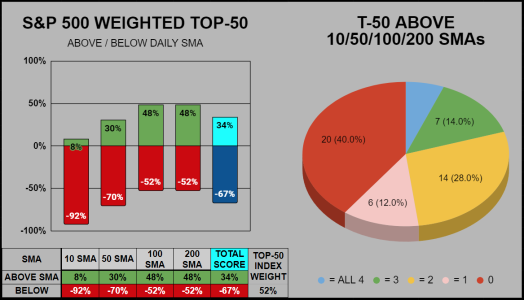
There's little allocation movement on the TSP AutoTracker, last week participants lost 1.84% YTD, while the Top-50 remains largely in the S-Fund, with this group losing 2.93% YTD.

____
The Day of Week stats are also largely unchanged, we are still trading under the 21-Year 54% daily win ratio. The last 2 Tuesday/Fridays have closed down. The last 7 of 11 days closed down.

___
On the S&P 500, price is under the 10-SMA by -2.34%, this is in the bottom 92% percentile range.

___
The S&P 500's weighted Top-50 has lost some momentum, with only 4 of 50 stocks trading above the 10-SMA.

JTH
TSP Legend
- Reaction score
- 1,158
Thanks for the update, I had my own issues as well. I submitted a full withdrawal on Sunday 12-Feb. I had planned to do a partial withdrawal, so the funds could be disbursed into 2 IRA accounts. Problem was I couldn't do a partial withdrawal without them withholding 20% taxes. I changed my tax bracket setting, but still had issues. I must say they have this website setup shady, as if attempting to scare you away from rolling out your money.
Either ways it's done, now I pray and hope, a paper check doesn't get lost and/or my broker doesn't screw anything up....
The IRA transfer out of TSP is complete, so from start to finish it took 11 business days, not bad.

JTH
TSP Legend
- Reaction score
- 1,158
Re: Sunday: Bears take the lead
Good morning
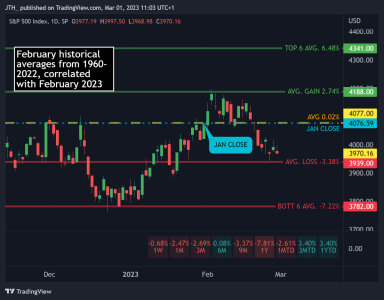
Closing out the month, February 2023 (when correlated with the previous 63 Februaries), reached both the "Average of all gains" at 4188 and close to the "Average of of all losses" at 3939.
In terms of TSP, trading off those historical levels could have provided "roughly" a 2.59% gain and avoided a -5.01% loss.
___
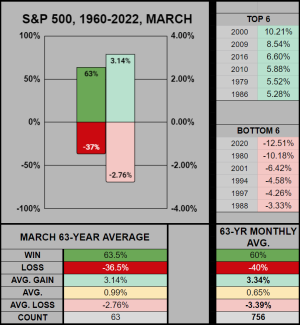
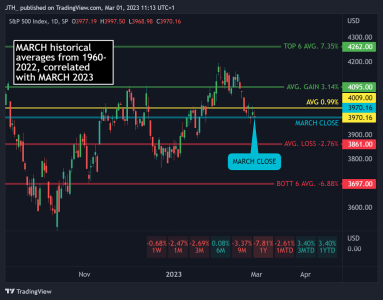
For the March historical averages, buyers could consider stepping in at 3861 "Average of of all losses" and sellers could consider stepping out at 4095 "Average of all gains".
___
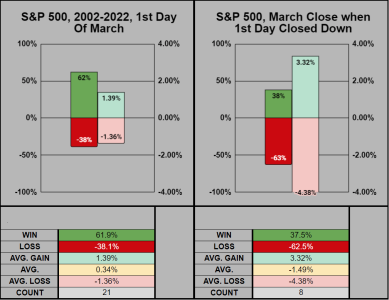
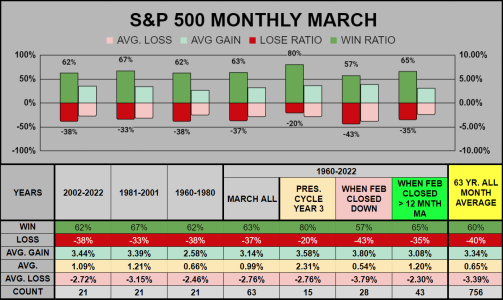
Statically speaking, March has been slightly above the 63-Year Monthly Average. The Presidential Cycle year 3 has an 80% winning ratio, but this data set only has 15 of 63 months of data to draw from.
Good morning
Closing out the month, February 2023 (when correlated with the previous 63 Februaries), reached both the "Average of all gains" at 4188 and close to the "Average of of all losses" at 3939.
In terms of TSP, trading off those historical levels could have provided "roughly" a 2.59% gain and avoided a -5.01% loss.

___
For the March historical averages, buyers could consider stepping in at 3861 "Average of of all losses" and sellers could consider stepping out at 4095 "Average of all gains".

___
Statically speaking, March has been slightly above the 63-Year Monthly Average. The Presidential Cycle year 3 has an 80% winning ratio, but this data set only has 15 of 63 months of data to draw from.

felixthecat
TSP Analyst
- Reaction score
- 41
- AutoTracker

Re: Sunday: Bears take the lead
Very useful information. Fits into thr master plan where we are headed. thank you JTH. Keep up the good work!

Good morning
Closing out the month, February 2023 (when correlated with the previous 63 Februaries), reached both the "Average of all gains" at 4188 and close to the "Average of of all losses" at 3939.
In terms of TSP, trading off those historical levels could have provided "roughly" a 2.59% gain and avoided a -5.01% loss.
View attachment 57374
___
For the March historical averages, buyers could consider stepping in at 3861 "Average of of all losses" and sellers could consider stepping out at 4095 "Average of all gains".
View attachment 57375
___
Statically speaking, March has been slightly above the 63-Year Monthly Average. The Presidential Cycle year 3 has an 80% winning ratio, but this data set only has 15 of 63 months of data to draw from.
View attachment 57376
Very useful information. Fits into thr master plan where we are headed. thank you JTH. Keep up the good work!
JTH
TSP Legend
- Reaction score
- 1,158
JTH
TSP Legend
- Reaction score
- 1,158
Re: Sunday: Bears take the lead
Post 3 (a minor note)
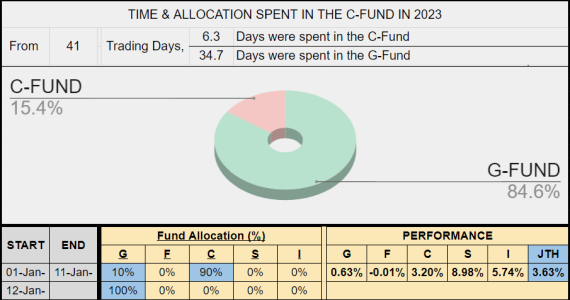
Since I've rolled out of the TSP into an IRA, this means I'm now paper trading the AutoTracker. To keep it interesting, my goals are simple. Invest in only the G-Fund & C-Fund, be invested as little as possible (timewise) and outperform the C-Fund. If possible, I'd like to be invested in the C-Fund less than 50% of the time, while also outperforming the fund.
Using part of Tom's spreadsheet and calculating allocation & time, thus far I've been invested in the C-Fund 15.4% of the time.

Similar threads
- Replies
- 0
- Views
- 80
- Replies
- 0
- Views
- 82
- Replies
- 0
- Views
- 102
- Replies
- 1
- Views
- 213

