JTH's Account Talk

Good morning (Post 1 of 2, January)

I apologize there's a lot to digest here, so I'll try to keep it brief.

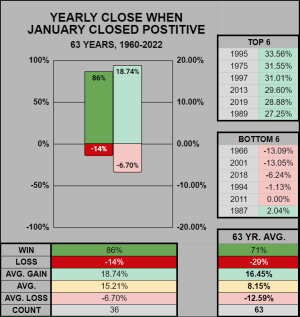
Going back to 1960, this January ranked as the 10th best of 64. When January closed positive, the previous year closed positive 31 of 36 times or 86% which is 15% more than the 63 year average 71% win ratio.
20230129-JAN+.png


___
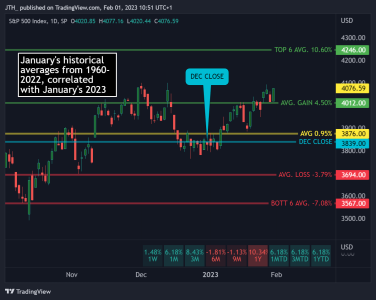
With a 6.18% gain, this January also closed above it's 4.50% average positive gain (only positive closes counted.)
20230129-MNTH-STAT.png

Discussion begins at 10:40, with the Editor of the Stock Trader's Almanac regarding the January "Trifecta" and the Presidential cycle.


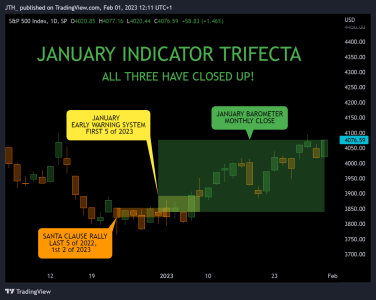
Lastly, the January Trifecta (as outlined in the video) has closed positive across all 3 indicators. I would encourage you to watch the video for the specifics, but for the time-constrained (historically speaking), it's bullish.
20230129-JAN-TRIFECTA.png
 
Post 2 of 2, February

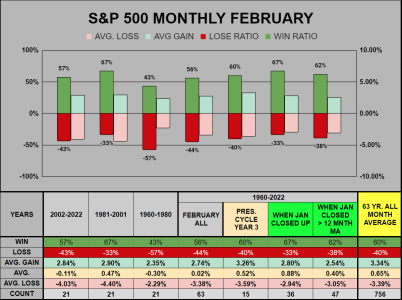
From 1960, looking at past performance, February is a bit below average in some areas, with a low average return.

-- Looking at the bottom 20% of all 756 months, of those 150 months, only 17 (or 11%) fell in the month February.
-- From the 36 times January closed positive, February closed positive 67% of the time.
-- We have our first Monthly close above the 9/12 Monthly SMA since March 2022.

20230129-FEB-ALL.png

___
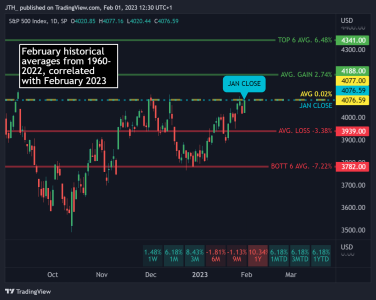
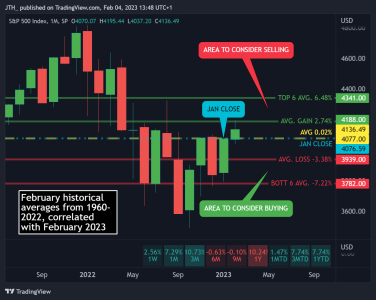
Based on past performance, if we have a good month, we might find a good exit around 4188 with an average gain of 2.74%. Or perhaps a good buy around 3939 which is -3.38% below the January close.

20230129-FEB-STAT.png


___

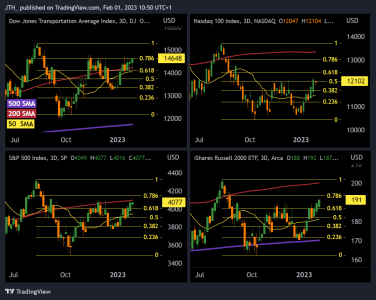
Of the 4 major indexes I follow, from the Aug high to Oct low, the NASDAQ 100 is the weakest within the Fibonacci range.

Off the 13 Oct bottom: TRAN 20.35%, NDX 17.31%, SPX 16.77%, IWM 17.90%

20230129-QUAD.png

___

Lastly, here's a key reason I'm somewhat cautious on the general health of the markets.

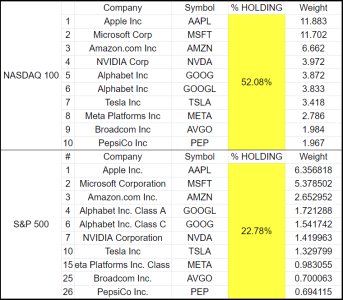
By weight, the top 10 components of the NASDAQ 100 make up 52% of the Index. Those same 10 components are in the S&P 500's top 26 having a 23% weighting.

Of those 10, only 2 (NVDA & AVGO) are trading above their 200 SMA. With a lot of news/earnings this week, my perception is the markets might put in a reversal after the news is digested, so for the moment I'm still largely in cash. Thanks for reading!

20230129-WEIGHT.png
 
The numbers say we have a chance of having a good year. Let's hope we can trust the numbers. :wall:
 
The numbers say we have a chance of having a good year. Let's hope we can trust the numbers. :wall:

Yea, from a historical viewpoint, I think this is as good as it gets. What I do find interesting is there are many fund manger CNBC types who appear to be very cautious, they are waiting/expecting a pullback, and I tend to agree with that view, but the markets don't seem to care about rational expectations. So the markets are right, and I'm wrong, but eventually my broken clock will be right again. :)
 
Re: Sunday: Bears take the lead

Good morning

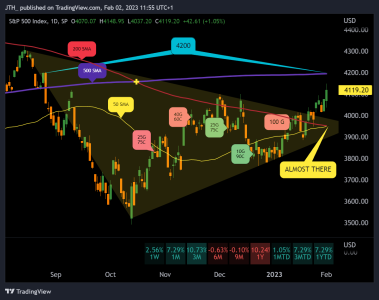
Off current levels, we are just 5% below the Aug high. Perhaps some minor previous resistance at 4200, and the 500 SMA, otherwise the skies look clear. Also, the October low is sitting -15.24% below us, so at this juncture, without some serious unforeseen event, it seems doubtful (for me) that we will retest the 2022 low.

The 50/200 Golden cross is at our doorstep, perhaps 1-2 days away, I'm sure it make for a nice weekend news story.

20230129-SPX.png


___
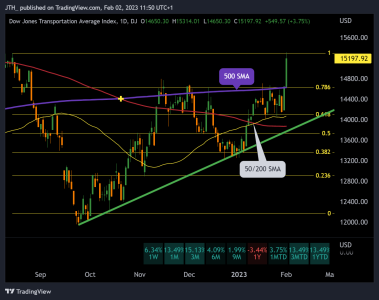
Perhaps more impressive is the Transport's double top, with a well-tested area of support across the rising green trendline.

20230129-TRAN.png
 
Re: Sunday: Bears take the lead

Good morning

Outside of TSP, I've faded as much of this impressive rally as I can. Currently sitting 30% SGOV (0-3 Month Treasury Bond ETF), I won't raise anymore cash at this point.

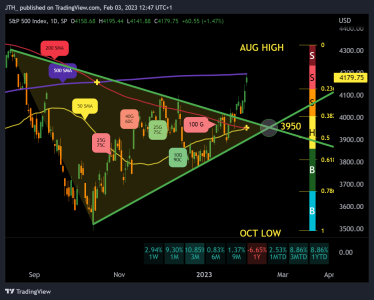
The S&P 500 fell just short of 4200 which was sort of expected, although I didn't think we'd hit this level so quickly. I'm still interested in a test of the 3950 area, where the 50/200 SMA Golden Cross has now played out, 3950 is also week 4's low, and is an area where the two green trendlines converge.

20230203-CHART.png
 
Close enough to 4200 for me and yes, it got there really quick.

I pushed 25% into C, S and I back in May and 90% of future contributions.
I'm about .82 cents short of break even on the C fund, +.96 cents on the S fund and +$2.50 on the I fund.

Hoping for a slow or up day so I can quietly take my beer money back to the garage.
 
Re: Sunday: Bears take the lead

Good afternoon

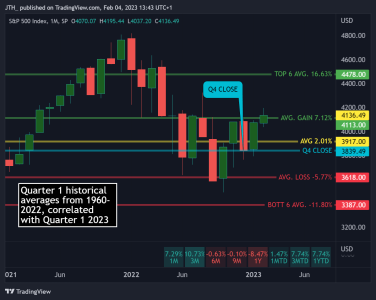
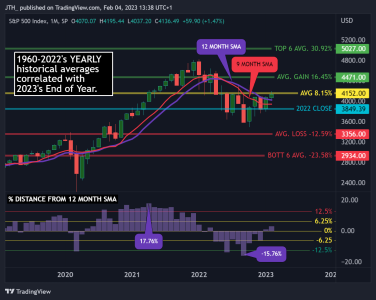
Here's the present status of prices based on historical Februaries, Quarter 1s, and years from 1960-2022. All timeframes are displayed Monthly.

1.47% MTD the S&P 500 has breached above 2.74% which is the average of all positive Februaries, the month is looking good.

20230205-MNTH-STAT.png

___
7.74% QTD Our 1st quarter chart looks great too, we've already closed above 7.12% which is the the average of all positive Q1s.

20230205-QRT-STAT.png

___

7.74% YTD Lastly the yearly chart, we can see the 63-year average of all closes is 8.15% and this 4152 level was already breached on the 22nd trading session. So in theory, if you exited on Thursday and stayed in the G-Fund for the rest of year, you will have beaten the average returns for the previous 63 years. :)

20230205-YR-STAT.png
 
Re: Sunday: Bears take the lead

Good morning

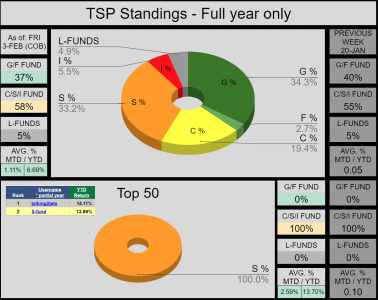
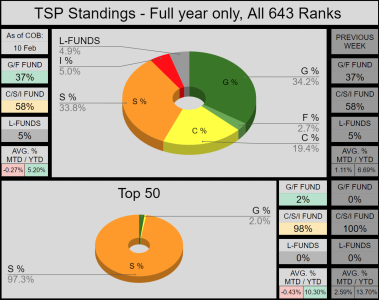
There's a minor change to the Auto Tracker chart, it now shows full year participants only. For this week, 2/3rds of all members are in the G/S funds, while the Top-50 is all in on the S-fund. A member since 2011, Talking2jets is the only participant outperforming all funds (impressive). Also, the Top-50 is outperforming the entire board by over 2X both MTD & YTD (also impressive).

20230205-AT.png

___

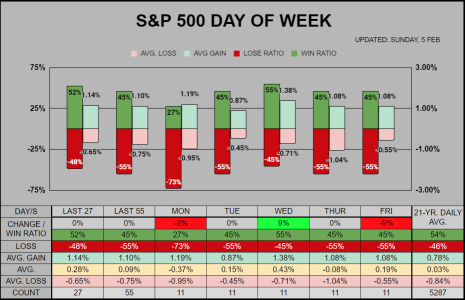
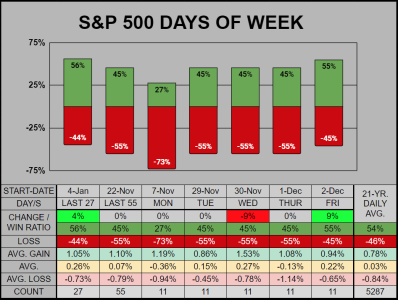
For the Day of Week chart, overall the 27/55 day stats are still below the 54% 21-year win ratio. Mondays have been the weakest with 8 of 11 closing down, but bear in mind (going back to December), there have been 3 holidays falling on a Monday, so to get 11 Mondays we have to go back further in time than the other days of the week.


20230205-DoW.png

___

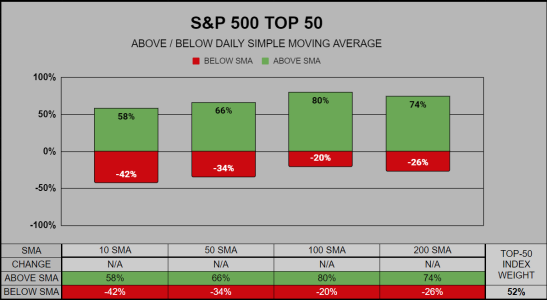
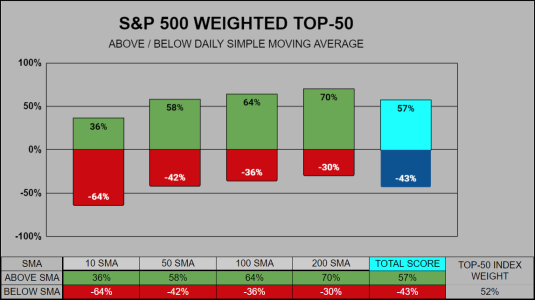
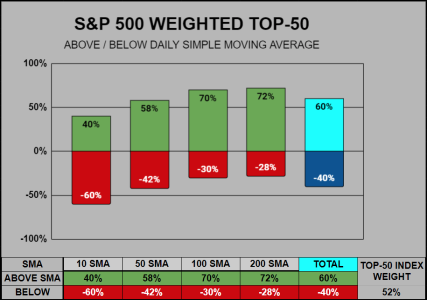
​Here's a new chart with a different perspective. The S&P 500 is comprised of 503 holdings. By weight, the Top-50 make up 52% of the index. This chart tracks the Top-50's prices above & below the 10/50/100/200 day simple moving averages. My goal here is to look for warning signs for when the markets momentum has turned.

As of now, it looks healthy:

The Top-2 by 12% weight (Apple/Microsoft) are above all 4 moving averages.
The Top-5 by 18% weight are above the first 3 moving averages but below the 200 SMA.

20230205-T50.png
 
Re: Sunday: Bears take the lead

Good morning

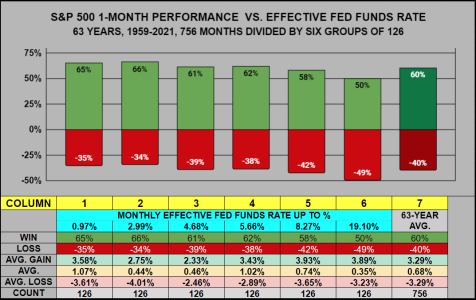
Reading Tom's Blog this morning, he discussed interest rates in relation to market performance (from a technical analysis perspective). This had me wondering if I could find a correlation between the Monthly Effective Fed Funds Rate, and the S&P 500's performance.

So I sorted across the 1/3/6/9/12 Month timeframes. Admittedly, I was somewhat disappointed, with the results, as there was no "smoking gun", there are some correlations, but the bulk of the data is conflicted. Perhaps it's possible this index is better shielded against a rising rate, and maybe a smaller cap index would generate more clearly defined results. I'll post a chart each day this week, starting today with the 1-Month chart.

NOTE: Comparisons are made with Column 7 which is the 63 Year 1-Month Average. For this data, the Median rate is 4.68% while our current rate (today) is 4.58%

Columns 1 & 2, when the interest rate is in the 0-3% range, the win ratios are higher, but the average gains/losses are mixed. In column 6, when the interest rate was higher than 8.27% the Win ratio went down -10% below the 63 year average. And while the average of all gains were higher, the overall averages were lower, and the average of all losses were also lower (than the 63 year average).

20230205-FED-1.png


Good morning

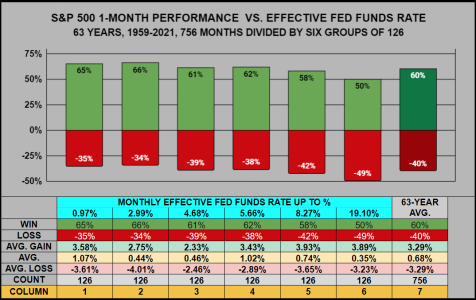
Columns 1 & 2, when the interest rates were lower than 3.00% the win ratio was above the 63-year 3-month win ratio.
Columns 6, when the interest rates were higher than 8.27% the win ratio was lower than the 63-year 3-month win ratio.

Concerning the average of all gains, all averages, and average of all losses, there was no distinct correlation I could identify.

20230205-FED-3.png

NOTE: Comparisons are made with Column 7 which is the 63 Year 3-Month Average. This is not just quarterly, this is all 3-month periods. For this data, the Median rate is 4.68% while our current rate (today) is 4.58%


Post #2

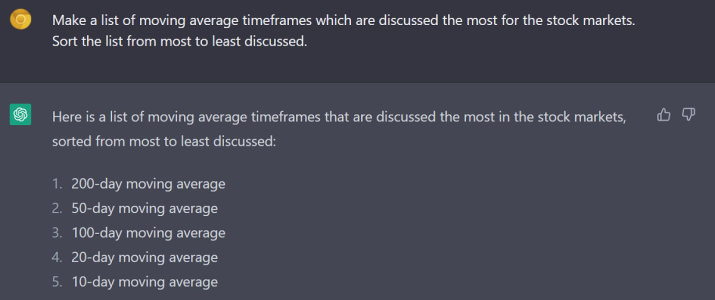
According to ChatGPT:

20230205-LIST.png

___

Unfortunately, ChatGPT is limited and restricted, it does not have the data I need for world domination, so I'll have to do this myself :)
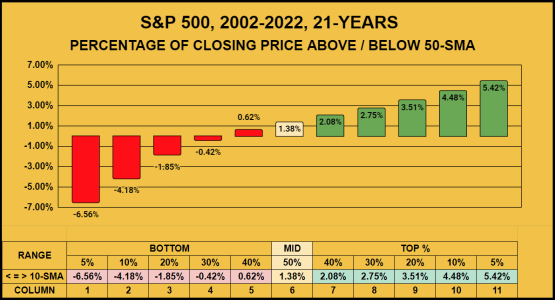
This somewhat convoluted chart is a visual representation of the amount of days and percentage range above and below the 50-SMA.

Column 1-5 tells us the S&P 500 closed below the 50-SMA 33.9% of the time.
Column 6 tells us the S&P 500 closed 0% to 2.49% above the 50-SMA 32.63% of the time.
Column 1-3 If I were trading based on this data, I would likely, buy here. Only 7.9% of the days/time were less than -5% below the 50-SMA.
Column 8-10 The same in reverse, I would likely, sell here, as only 6.8% of the days/time were more than 5% above the 50-SMA.
As of this Monday, we closed 3.83% above the 50-SMA, which would fall into Column 7 where the index has been 26.67% of the time.

View attachment 57214
 
Alright, the previous 50-SMA chart was too confusing to read (even by my standards).

Long story short, Monday, we closed 3.83% above the 50-SMA. This falls within Column 8, where 26.63% of days closed in this range (or 1408 of 5287 days). If we were to move further right into Columns 9/10/11/12 then this may warn us we are getting overbought.

View attachment 57224
 
Good afternoon

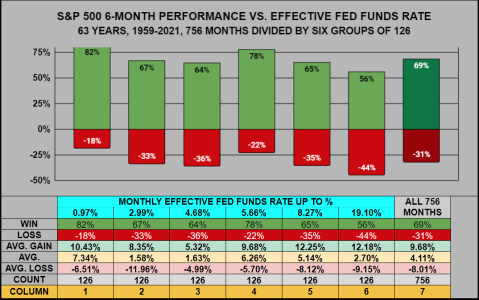
Looking 6 months past what was the current monthly Effective Funds Rate, we can see that when the rate is under 1% the Win Ratio and averages were better than the 63 year average (Column 1). But again, as the interest rates rise, the averages don't show a distinct correlation. So 6 months out from a rate hike, does not always mean the returns will fall.

20230205-FED-6.png
 
Re: Sunday: Bears take the lead

Good morning

Nothing unusual to report. On Wednesday the S&P 500 closed 3.88% above the 50-SMA. When compared to the previous 21-years, this is in the Top 15% of closes and would fall within column 9.

20230209-50SMA.png


___

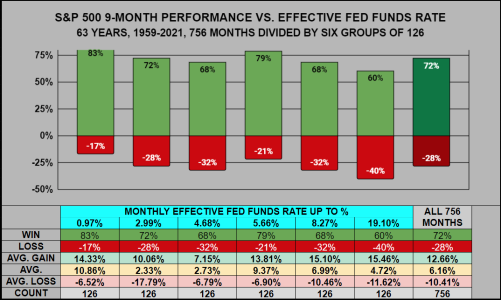
Looking 6 months past out (into the future) what was the current monthly Effective Funds Rate, we can see that when the rate is under 1% the Win Ratio and averages were better than the 63 year average (Column 1). But again, as the interest rates rise, the averages don't show a distinct correlation. So 6 months out from a rate hike, does not always mean the returns will fall.

Per the usual conversation the 9-Month charts is similar to the 6-Month.

20230205-FED-9.png
 
Re: Sunday: Bears take the lead

I've submitted some questions to the TSP.GOV since I'm uncertain what the answers are.

1) I would like to transfer a portion of my TSP traditional account, into two separate Traditional IRAs at two different times, is this possible?


2) A portion of my TSP is tax exempt, will this present a problem or trigger a taxable event?

Of course of you know these answers, please assist if you can, thanks :)
 
Good morning

For the S&P 500 Top-50 by weight, 10 are above all SMAs including the Top-2 AAPL/MSFT, while 6 are under all SMAs. In the short-term, we can see the 10-SMA has taken a dip, but the overall total score is 57%, so nothing too concerning at the moment.

20230209-T50-W.png

___
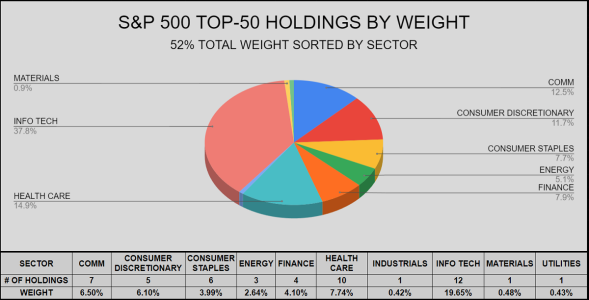
Of those Top-50 which are 52% of the entire index, here's a sector breakdown, noting that the Real Estate sector is not represented in the Top-50.

20230209-T50-S.png
 
Re: Sunday: Bears take the lead

Here's a CPA's website and a retired fed who specializes in FERS and TSP financial advice. His blog may have some insight into your questions JTH.

https://www.barfieldfinancial.com/new-blog/tsp-to-ira-transfer-a-how-to


I've submitted some questions to the TSP.GOV since I'm uncertain what the answers are.

1) I would like to transfer a portion of my TSP traditional account, into two separate Traditional IRAs at two different times, is this possible?


2) A portion of my TSP is tax exempt, will this present a problem or trigger a taxable event?

Of course of you know these answers, please assist if you can, thanks :)

Got a reply.

Thank you for contacting the ThriftLine Service Center. We will be more than happy to assist you with your rollover inquiries.


You can request two separate partial distribution rollover requests, but you can only request one partial distribution per 30-day calendar period.

Combat Zone pay contributed as Traditional contributions is separate from the rest of a participant's traditional TSP money and will not be taxed. Earnings on those contributions will be taxed upon withdrawal.

As always, if you have any additional questions or concerns feel free to respond to this email, utilize our live chat option, or call in to the ThriftLine for assistance at 1-877-968-3778, Monday through Friday, from 7:00am est to 9:00pm est.

ThriftLine Service Center
 
Sunday: Small pullback

Good morning

Going into Monday, little has changed with the Auto Tracker's allocations. Overall, this week we've lost -1.49% YTD, but 38% of all participants are outperforming the C-Fund. The Top-50, are still mostly in the S-Fund, with these participants losing -3.4% YTD, but all are still outperforming the C-Fund, and 4 members are outperforming all funds.
20230212-AT.png
___
On the Day of Week chart, I've added start dates, so we can see how far back each statistic goes, here we can see Monday (due to holidays) is still 3 weeks behind Tue-Fri. So Monday still has an abysmal 27% win ratio, while the last 27 days & Friday are on par with the 21-year average. 5 Wednesdays have the best average of gains at 1.53% , while 6 Thursdays have the worst average of losses at -1.14%
20230212-DoW.png

___
For the S&P 500's Top-50 weighted stocks (52% of the entire index), the NASDAQ 100 shares 16 of those same stocks. For the S&P 500, those 16 stocks are weighted at 27%, and for the NASDAQ 100 at 61%.


At the moment the Top-50 look fairly healthy, 9 are trading above all SMAs, while 7 are trading below.
20230212-T50.png
 
Back
Top