-
The Forum works well on MOBILE devices without an app: Just go to: https://forum.tsptalk.com
-
Please read our AutoTracker policy on the IFT deadline and remaining active. Thanks!
-
$ - Premium Service Content (Info) | AutoTracker Monthly Winners | Is Gmail et al, Blocking Our emails?
Find us on: Facebook & X | Posting Copyrighted Material
-
Join the TSP Talk AutoTracker: How to Get Started | Login | Main AutoTracker Page
You are using an out of date browser. It may not display this or other websites correctly.
You should upgrade or use an alternative browser.
You should upgrade or use an alternative browser.
JTH's Account Talk
- Thread starter JTH
- Start date
JTH
TSP Legend
- Reaction score
- 1,158
Re: Sunday: Bears take the lead
Good Morning
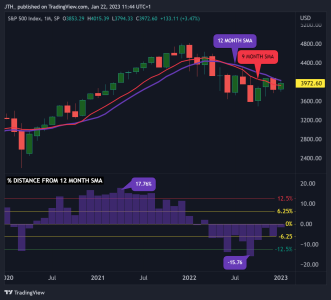
For a long-term Monthly perspective, we can see we are currently sandwiched in-between the 9 & 12 MONTH SMAs.
-- The 12-MONTH SMA is at 4032, we haven't closed above this level since March 2022.
-- The Percentage distance of price from the 12-Month SMA gives us a nice perspective within the longer timeframe.
-- From the Pandemic bottom I've marked -12.5% as an oversold condition occurring 3 times in the previous 34 months.
-- If we were to hit another extreme oversold condition at -12.5% this would take us to 3525, just above October's bottom.

JTH
TSP Legend
- Reaction score
- 1,158
Re: Sunday: Bears take the lead
Good morning
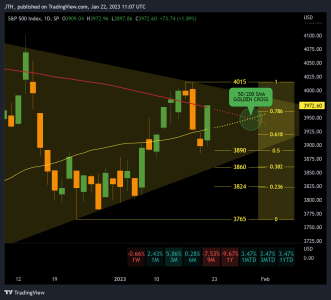
Not much to report, there is the possibility of a 50/200 crossover towards the end of the month. Some years back, on the S&P 500 I did perhaps thousands of scans on moving average crossovers triggering long buy/sells based on end of day prices. My conclusion (for myself) was that they consistently underperformed Buy & Hold during almost all timeframes. I even found that in some cases inverse bearish crossovers performed better on the shorter moving averages. My final conclusion, there is no Golden Cross Bullet, but if it brings more players to the table, then I'm happy to let them drive prices up.

JTH
TSP Legend
- Reaction score
- 1,158
Re: Sunday: Bears take the lead
Post 2 of 2
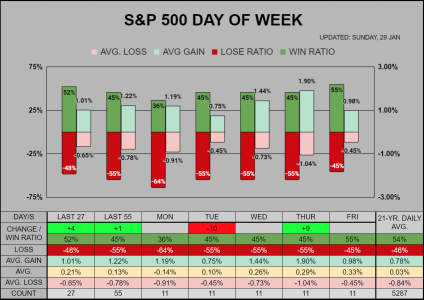
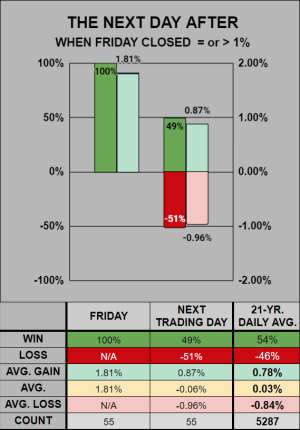
Last Friday closed up an impressive 1.89% When compared to the previous 21 years, this would have ranked as the 218th best day of 5,287 days, putting it in the top four percentile. Looking at the previous 55 Fridays which closed = or > 1% the next days performance had a 49% win ratio.
___
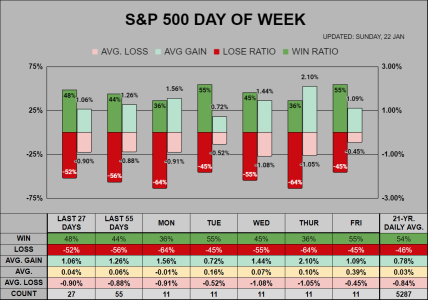
The Day of the Week chart is largely the same, I've added a Last 27 Days column to giver a shorter perspective, perhaps making it easier to identify a trend change in the win ratios. Last 3 Fridays closed up 1.89% / .40% / 2.28%
Post 2 of 2
Last Friday closed up an impressive 1.89% When compared to the previous 21 years, this would have ranked as the 218th best day of 5,287 days, putting it in the top four percentile. Looking at the previous 55 Fridays which closed = or > 1% the next days performance had a 49% win ratio.

___
The Day of the Week chart is largely the same, I've added a Last 27 Days column to giver a shorter perspective, perhaps making it easier to identify a trend change in the win ratios. Last 3 Fridays closed up 1.89% / .40% / 2.28%

JTH
TSP Legend
- Reaction score
- 1,158
Re: Sunday: Bears take the lead
As of Friday, the top 50 is heavy is the S/I Funds.
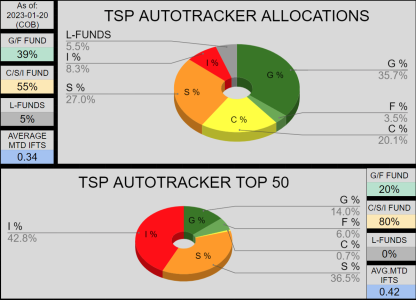
Going into this week, we can see that (for all members) about 43% are in G/F funds while 51% are in the C/S/I funds. In contrast, the Top 50 are heavy in the S-Fund at 85%, with only 3 members having an I-Fund allocation and they happen to hold the Top 3 positions.
As of Friday, the top 50 is heavy is the S/I Funds.

JTH
TSP Legend
- Reaction score
- 1,158
Re: Sunday: Bears take the lead
Yea me too, I would like to take an entry with the I-Fund, but the biggest problem I have with it, is I feel it's more difficult to track multiple countries and the USD all at the same time verses the the C-Fund where I can draw from multiple points of view on the S&P 500.
I wonder how much more bounce the "I" fund has? It's been on a good streak for the last two months.
Yea me too, I would like to take an entry with the I-Fund, but the biggest problem I have with it, is I feel it's more difficult to track multiple countries and the USD all at the same time verses the the C-Fund where I can draw from multiple points of view on the S&P 500.
JTH
TSP Legend
- Reaction score
- 1,158
Good morning
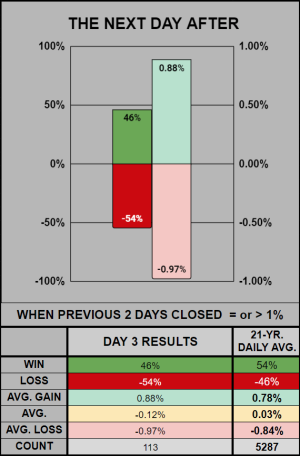
From 2002-2022 there were 113 occasions where the S&P 500 close up = or > 1% two days in a row. From these occasions the 3rd day's average performance is listed below.
___
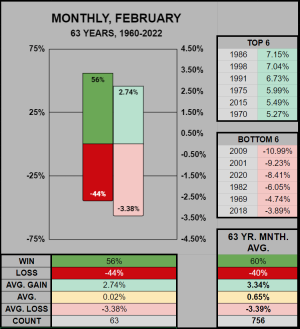
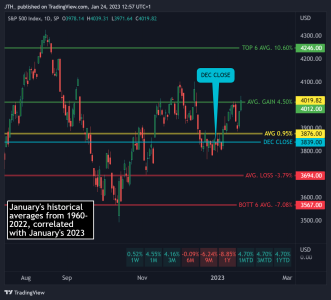
The previous 63 Januaries positive closes have averaged 4.50%. On Monday we closed MTD above this level.
___
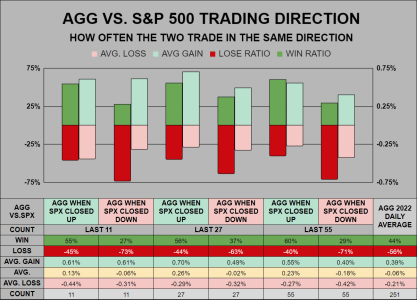
From last Friday, when SPX closed up, AGG has closed up 55-60% of the time, but when SPX closed down, AGG closed down 63-73% of the time. Sort of makes it hard to want to stay invested in bonds under these conditions where you both win less often, and lose more often...
From 2002-2022 there were 113 occasions where the S&P 500 close up = or > 1% two days in a row. From these occasions the 3rd day's average performance is listed below.

___
The previous 63 Januaries positive closes have averaged 4.50%. On Monday we closed MTD above this level.

___
From last Friday, when SPX closed up, AGG has closed up 55-60% of the time, but when SPX closed down, AGG closed down 63-73% of the time. Sort of makes it hard to want to stay invested in bonds under these conditions where you both win less often, and lose more often...

JTH
TSP Legend
- Reaction score
- 1,158
Epic
TSP Pro
- Reaction score
- 365
:nuts: GOLDEN CROSS :nuts:
I haven't heard that term used in a hella long time for the S&P. That's exciting !!!
https://markets.businessinsider.com...ross-analysis-buy-signal-sp500-outlook-2023-1
If the technical signal does materialize, it would be the first time for the S&P 500 since July 2020 amid the ongoing recovery from the COVID-19 pandemic. Stocks went on to surge as much as 52% after the July 2020 golden cross.
In December, the Dow Jones Industrial Average flashed the golden cross signal. Since then, the index is about flat.
JTH
TSP Legend
- Reaction score
- 1,158
:nuts: GOLDEN CROSS :nuts:
I haven't heard that term used in a hella long time for the S&P. That's exciting !!!
https://markets.businessinsider.com...ross-analysis-buy-signal-sp500-outlook-2023-1
If the technical signal does materialize, it would be the first time for the S&P 500 since July 2020 amid the ongoing recovery from the COVID-19 pandemic. Stocks went on to surge as much as 52% after the July 2020 golden cross.
In December, the Dow Jones Industrial Average flashed the golden cross signal. Since then, the index is about flat.
Yep, within the grand scheme of things, it really isn't something that can be timed perfectly. But for many newer investors, moving averages are one of the first things we learn. I don't trade on MAs, but I always watch those levels because I know other investors care about them. Either ways, it will make for a good news headline for the average investor to read about when/if it does happen.
JTH
TSP Legend
- Reaction score
- 1,158
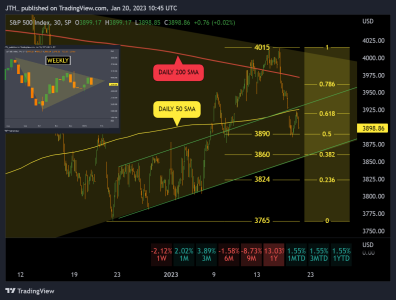
I've brought the minor support level up to 3885 which was an area of previous resistance and support.
Good morning
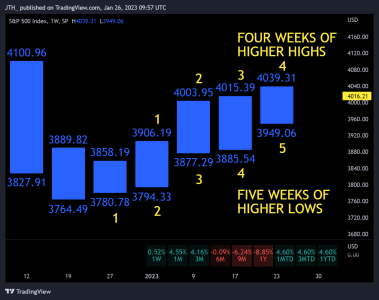
From this perspective, bulls control prices over the past 4/5 weeks. Here is a weekly high/low chart, if we don't go below the previous week's 3885.54 low, then we will have formed 5 higher weekly lows and 4 higher weekly highs.
JTH
TSP Legend
- Reaction score
- 1,158
From this perspective, bulls control prices over the past 4/5 weeks. Here is a weekly high/low chart, if we don't go below the previous week's 3885.54 low, then we will have formed 5 higher weekly lows and 4 higher weekly highs.
Good morning
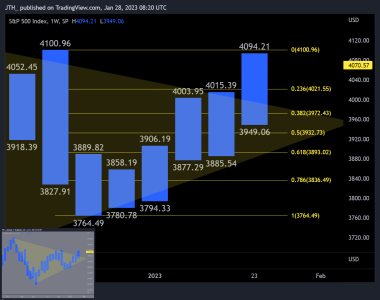
With the Weekly HIGH/LOW chart we can see this week closed out with 5 higher lows and 4 higher highs. The bottom left corner thumbnail shows we've broken above the previous resistance within this triangle pattern.
JTH
TSP Legend
- Reaction score
- 1,158
Re: Sunday: Bears take the lead
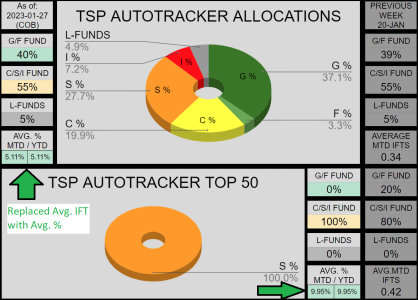
Last week's AT numbers were a little off because I didn't include all of the bottom members, that's been fixed for this week. I've also added a Previous Week column, so we can see the changes evolving. Lastly, I've changed the average IFTs to the average gain/loss MTD/YTD, it seems more useful.
I suspect as we progress through the year, the Top 50 won't show such dramatic changes. This week shows the Top 50 (actually Top 103) are all in the S-Fund.

JTH
TSP Legend
- Reaction score
- 1,158
Re: Sunday: Bears take the lead
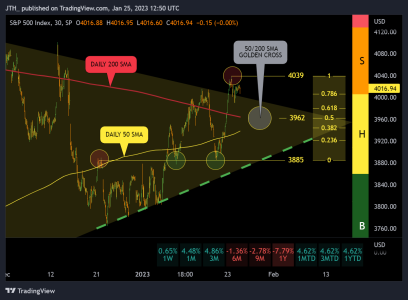
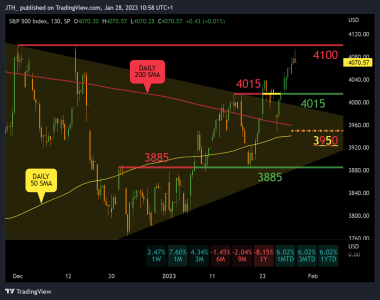
Here's a short-term 130-minute chart (3 bars per day) and the levels I'm interested in on this timeframe:
I'm bullish above 4015, an area of previous resistance.
I'm particularly interested in a test of 3950, an area where the 50/200 SMA may converge, also last week's low.
I'm bearish if we break below 3885, both an area where resistance & support were tested twice, and the 2nd previous week's low.
I do still have 1 IFT leftover from the 3970 exit, and while I detest starting the month in the G-Fund, at this stage (given the recent rise) I just don't want to chase after gains.

JTH
TSP Legend
- Reaction score
- 1,158
Re: Sunday: Bears take the lead
Good morning
The best part about technical analysis, is that when you're wrong, you never have to admit it. You just stop posting pictures of the old chart, post a new one and say " Hey look! Squirrel !!! " :cheesy:
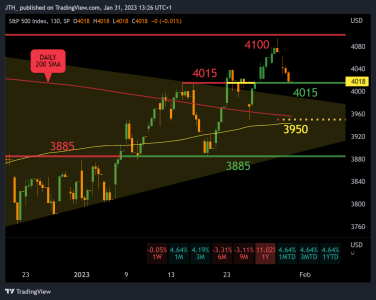
Here's a short-term 130-minute chart (3 bars per day) and the levels I'm interested in on this timeframe:
I'm bullish above 4015, an area of previous resistance.
I'm particularly interested in a test of 3950, an area where the 50/200 SMA may converge, also last week's low.
I'm bearish if we break below 3885, both an area where resistance & support were tested twice, and the 2nd previous week's low.
Good morning
The best part about technical analysis, is that when you're wrong, you never have to admit it. You just stop posting pictures of the old chart, post a new one and say " Hey look! Squirrel !!! " :cheesy:

Epic
TSP Pro
- Reaction score
- 365
Similar threads
- Replies
- 0
- Views
- 84
- Replies
- 0
- Views
- 85
- Replies
- 0
- Views
- 106
- Replies
- 1
- Views
- 213

