JTH's Account Talk


Good morning

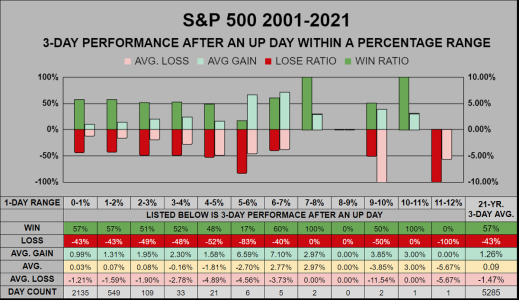
After a strong up day, do we get to hold onto those gains or should we exit?

Here's a part 2 for "How often the index closed up within a percentage range." This time we've measured the 3-day cumulative performance after those single up days.

Listed in the bottom right corner are the 21-year 3-Day averages, where we have a 57% win ratio (the benchmark for this chart). For the 0-1% & 1-2% column, we can see we are inline with the 3-day benchmark. However, from 2-6% the win ratio dips significantly, (but there is also significantly less days counted). My guess would be the smaller up days keep sellers at bay, while the larger up days, make them take some gains off the table.

20221127GainPART2.png
 
Good morning

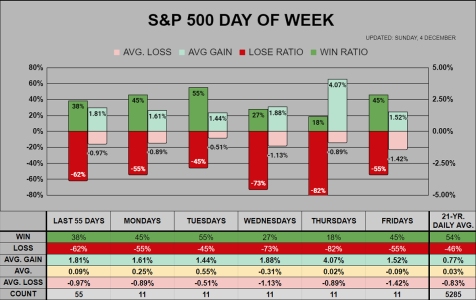
There's nothing unusual to report. This week's trading days 3-7 are very average. On the Day of the week chart, the last 55 day's 38% win ratio is below the 21-year 54% average. Also, we've lost -2.82% over the last 3 Mondays. Meanwhile Wednesday & Thursday have been stinkers, but last Wednesday did gain 3.10%

2022124-DoW.png


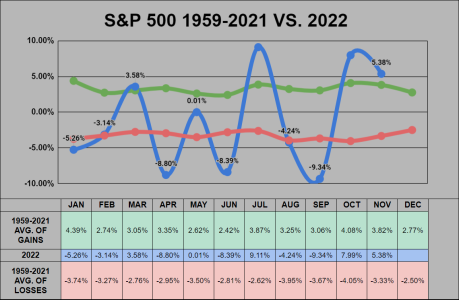
For some perspective, here's a Monthly chart comparing 2022 to the previous 63 years of positive and negative averages.
The price swing from Jun/July & Sep/Oct is epic!

2022124-63-22.png
 
Good morning

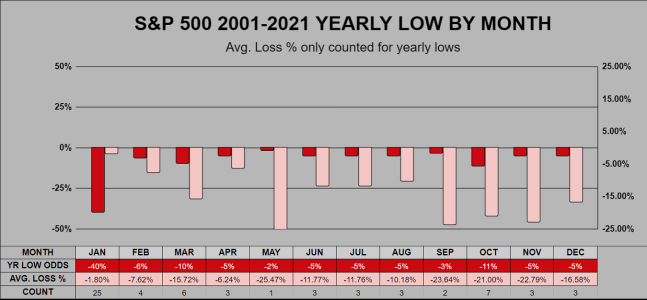
From the previous 63 years, we have the yearly low sorted by Month.

Jan has the worst odds, 25 of 63 times (or 40%), the yearly low fell within this month, but the average loss is not that bad. These stats are faulty because they really should be done on a rolling 12-month timeframe, but that would be a time-consuming effort on my part :)

Oct/Mar seem to be the biggest offenders here. Of note, in November 2008 the yearly low was -49.07%

MAX DRAWDOWN.png
 
Interesting as always! Maybe it's a little confusing to say January was the worst month. If I understand this, as an example January would be the lowest month if stocks went up every single day of the year, so by default the first trading day in January was the yearly low?
 
Interesting as always! Maybe it's a little confusing to say January was the worst month. If I understand this, as an example January would be the lowest month if stocks went up every single day of the year, so by default the first trading day in January was the yearly low?

True, it's not accurate to say Jan is the worst month, since all years start with Jan and most years are bullish. To get an accurate assessment, I'd need to do this chart 12 times, each starting at the next month. But this data was mostly hand-jammed, I couldn't get the conditional formatting to work correctly with google sheets. Along with doing this on a rolling 12-month, I'd also like to do it with max gain as well. But damm, I think it would take me (with my skills) a full day's work :)
 
IFT CoB Today, 25G/75C (From previous 40G/60C)

That leaves 1 IFT left to buy more if we go lower from here.
 
Small update, I hate to re-post a chart, but I hadn't noticed on the last day of Nov we closed the month above the 9 month SMA.

Good morning

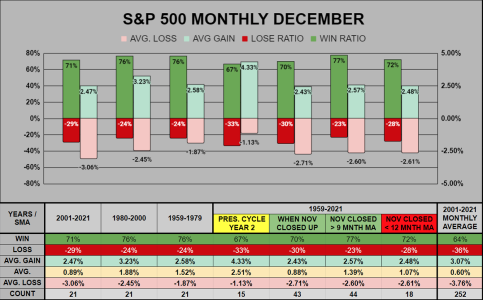
Damm me, reposting this a 3rd time, the Avg. Loss was calculated incorrectly. The revised numbers are significantly stronger (to the downside) compared to the previous chart, sry about that, I'm still a bit rusty.


DEC.png
 
Good morning (again)

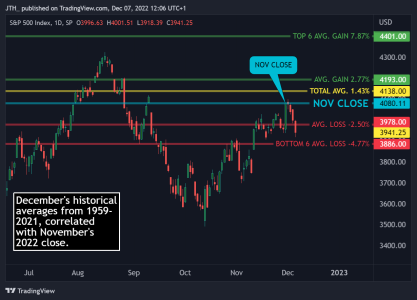
For those who are curious, the previous 63 Decembers closed down 16 times for an average loss of -2.50%

From this November's 2022 closing price, we are now below this -2.50% level.


STAT-M.png
 
The Santa Clause rally doesn't officially start until the 21st -- goes through the first two trading days in January. He still has time. :)
 
The Santa Clause rally doesn't officially start until the 21st -- goes through the first two trading days in January.

I'm hoping that's correct cause I'd love to jump in 2 to 3 days strait for some upside pump, and then quickly jump back out before the Mega-Crash of 2023. That may get me out of the negatives for the year. :nuts:
We'll see . . . . . That would be nice.
MT.PNG
 
Interesting as always! Maybe it's a little confusing to say January was the worst month. If I understand this, as an example January would be the lowest month if stocks went up every single day of the year, so by default the first trading day in January was the yearly low?

Good morning

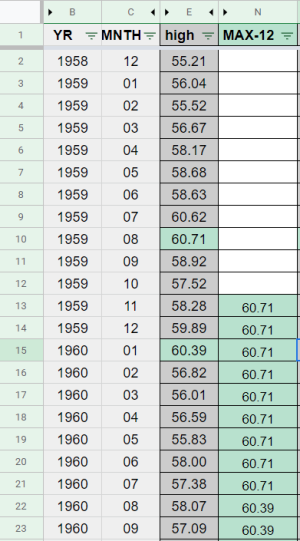
Still trying to figure out how to sort the monthly high/lows on a rolling 12 month timeframe. I could do this by hand, but it would take days and be subject to human error. I've been knocking my head trying to figure out how to highlight the max cell from 1 column of rows 1-12, 2-13, 3-14 etc, then filter it by the months, so I can make pretty chart...

T.png


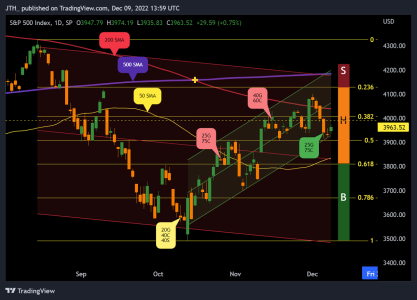
Anyways here's where I'm at for the month and where I'd like to buy/sell, happy Friday!

C.png
 
Happy Sunday

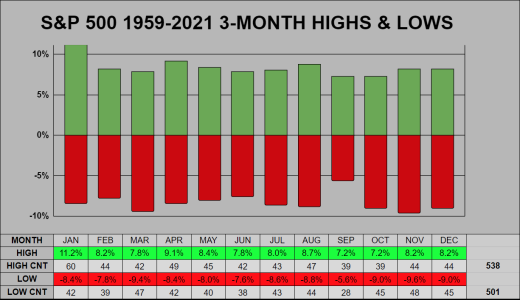
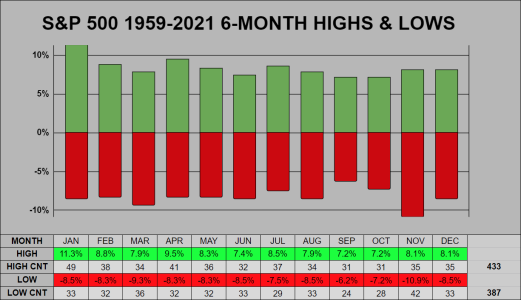
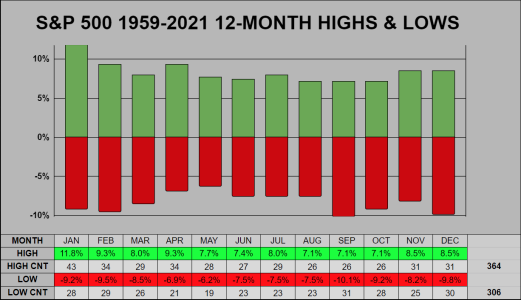
I had to enlist the help of a google sheets community forum to crack the formula needed. These charts record 3/6/12 Month Highs & Lows for each month.

As an example on the 1st chart:

January was the 3-month high 60 times (or 11.2%) of 538 3-month highs.
November was the 3-month low 48 times (or 9.6%) of 501 3-month lows.

Across all 3 charts, January has the most 3/6/12 month highs, while November had the most 3/6 month lows.

Important to consider, Jan 1961 was a 12-month high, but so was the next FEB/MAR/APR, so a 12-month high does not mean the market has peaked. Overall these statistic are unique, but they don't really tell you where to put up a caution flag, (good to know) but difficult to trade with this specific set of data.

HL-3M.png

HL-6M.png

HL-12M.png
 
Good morning

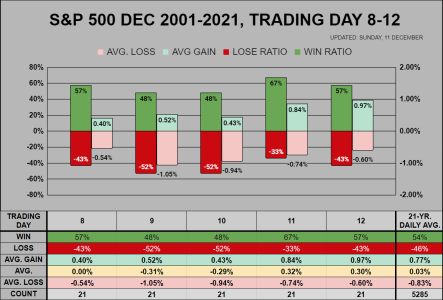
For December's trading day 8-12 there's an interesting observation:

Trading day 9 (last 9 of 11 closed down), trading day 11 (last 7 up) and last 10 of 11 closed up.

20221211-TRD.png


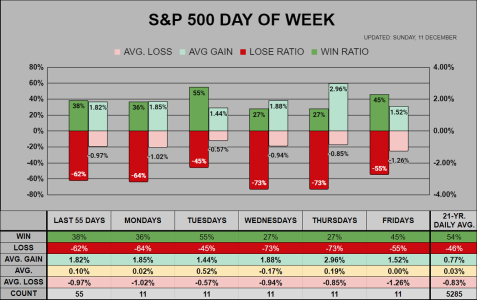
For the day of the week chart, the last 55 days are statistically weak, would you believe the last 9 of 11 days closed down? Also, the last 4 Mondays closed down, and last 3 Fridays closed down.

20221211-DoW.png


Good morning

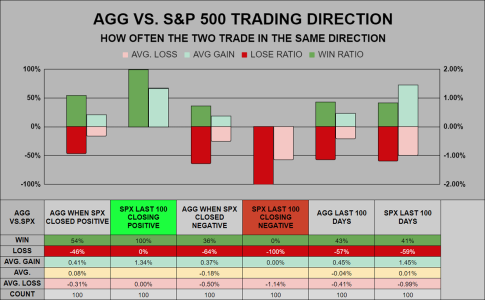
There's been a handful of times when I've swing traded between the C & F Funds. Sometimes they trade in tandem, while other times they are decoupled. The chart below represents the most recent relationship with these two funds. In the past I've done long-terms scans and recall the results were very much the same. For myself, I came to the realization that I preferred the stability and predictability of the G-Fund over the F-Fund, especially when they imposed the IFT limits.

Over the past 100 up SPX days and 100 down SPX days, AGG has traded in the same direction 59% of the time.
Over the past 100 days AGG has -.04% average returns vs. SPX at .01%


20221211-AGG.png
 
Good morning

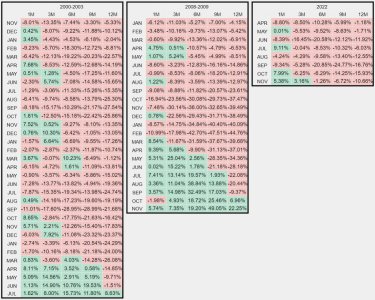
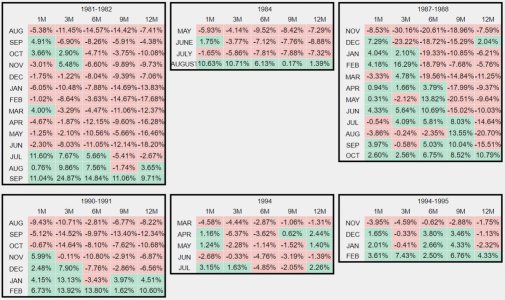
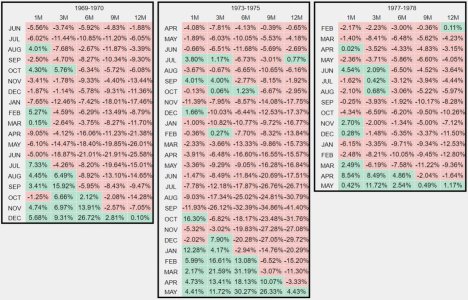
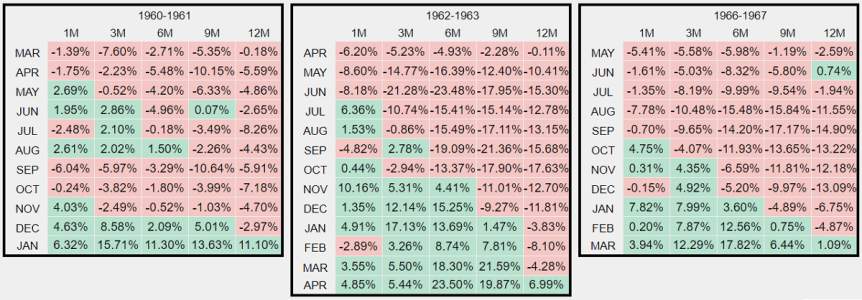
These charts represent a time perspective from where we've been in the past to where we stand today. From the pervious 63 years, there have been 14 occasions when the 1/3/6/9 & 12 Month performance closed down in the same month. These charts measure these events and the number of months it took until all months closed in the green again.

The 2000s & 1970s were brutal. For 2022, we are 8 Months into this negative performance, the average is 14 months. My apologies that the charts are a little blurry, they were resized, to fit and load quickly.


2000s.jpg

1980s.jpg

1970s.jpg

1960s.png
 
Good morning

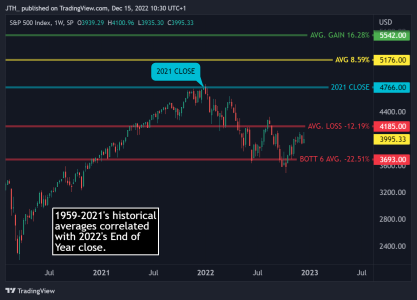
Here's a weekly chart illustrating where 2022 falls within the previous 63 years of historical averages. We are currently below the negative years (averaged together) but still above the average of the worst 6 years.

At the moment, we are between 1973's -17.37% and 1963's -13.09% which were the 4th & 5th worst over the previous 63 years.


STAT-2021.png
 
Good morning

While I am not as pessimistic as these charts would imply, I'm going to put my bear hat on today.

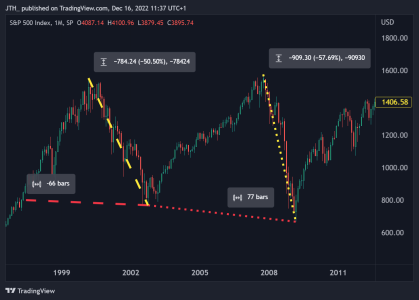
During this 12-year period (APR 1997 to MAR 2009) the S&P 500 lost over half its value twice, and went flat twice.

SPX MONTHLY
12-years.png


_____________
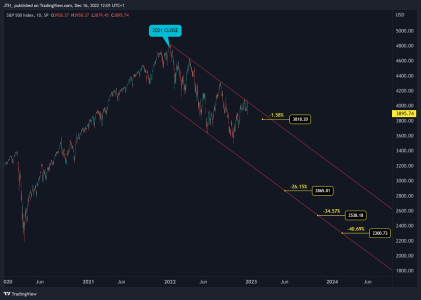
Moving to today, off the Pandemic low to our current 3895 price, we have 4 unfilled gaps below us. At the current rate of descension, I'd estimate we could reach the bottom 2300 gap by Feb 2024.

SPX DAILY
GAPS1.png
 
Sunday: Bears take the lead

Good morning and Happy Sunday.

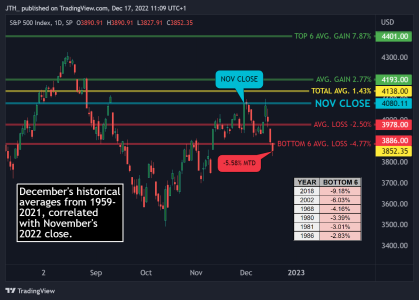
While (historically speaking) the remainder of December has favorable odds, the reality is we are currently down 2 weeks straight -5.39% and down for the month -5.58%, so even with an optimistic Santa rally, we would need to gain 5.91% to get back to November's high/close.

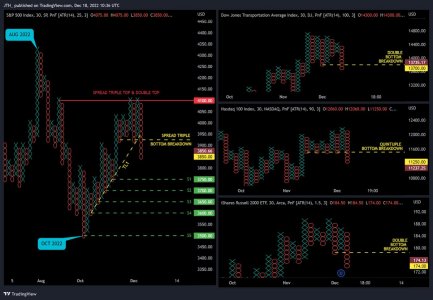
For an old school visual representation of the recent price action, we have the PnF 30-minute charts with the 4 major indexes I like to follow. S&P 500 has clear resistance above at 4100 tested 3 times, we've broken down through Trendline TL1, and have pierced under 3925 with a Spread Triple Bottom Breakdown. Importantly, we don't know if support levels S1-S5 will hold, as they are untested. Transports have a lower high, and a Double Bottom Breakdown. NASDAQ 100 previously had 2 higher Xs and now has a lower O with a (not often seen) Quintuple Bottom Breakdown. Russel 2K (like SPX) has clear resistance above at 189 tested 3 times, has put in a Double Bottom Breakdown, has 2 lower lows, and breached November's lows.
PnF.jpg


Historically Month-to-Date S&P 500 is below the bottom 6 negative average, and contending to be the 3rd worst when compared to the previous 63 Decembers.
20221217-MTD.png


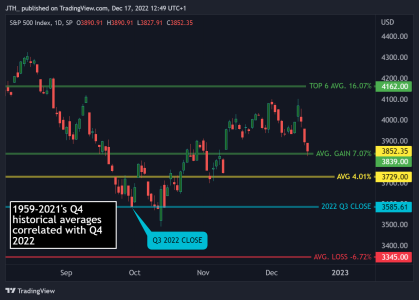
For the quarterly stats, we look pretty good, we are up 7.78% and contending for spot #24 when compared to the previous 63 4th quarters.
20221217-QTD.png

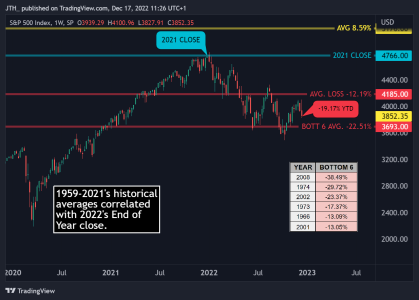
For the Year-to-Date stats, we are down -19.17% and contending for spot #4 as the worst when compared to the previous 63 years.

20221217-YTD.png
 
Back
Top