JTH's Account Talk

JTH- what's it mean O wise one...

Good question, I wish I could make sense of bonds as easily as stocks. My guess it it will need to pullback some to get back within the Bollinger Bands, the last time this happened was on 6 Jan 2015, we can see the results below.

003.png
 
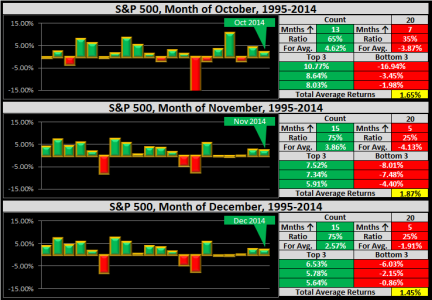
A while back, I purchased a new PC. Unfortunately, due to "operator error" I managed to delete the vast majority of my excel files, meaning I've lost several trading systems and my entire statistical database. It's been very depressing because I've put countless hours into this process, but I'm now at the point where I'm ready to begin anew and start building again. In the meantime, here's what the next 3 months look like, over the past 20 years.

1) Over the past 2 years, the months of October, November, and December have closed positive

2) October has a 65% winning ratio, with stronger average positive gains (that's good)

3) November has a 75% winning ratio, with stronger negative average gains (still good, but use caution)

4) December has a 75% winning ratio, with stronger average positive gains (that's very good)

Note: The average gains for October are 1.65% which happens to be the current gains over the past 2 days, perhaps I should quit while I'm ahead :laugh:

002.png
 
Thanks for the helpful information JTH. I hope there is still 1.65% to be had for the rest of October..:D:D

FS
 
+ .92 for this month. I'll gladly take more and even exceed 1.65 if you guys don't want to go over that! :cheesy:
 
4th QUARTER

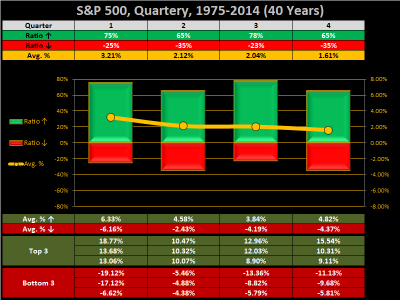
For the 4th Quarter, covering the 4 quarters of the year, over the past 40 years

65% winning ratio, ranking 3rd of 4

4.82% average positive gains, ranking 2nd of 4


1.61% average gains, ranking 4th of 4 (last place)


-4.37% average negative gains, ranking 3rd of 4


Based on the overall ranking, the 4th quarter ranks as the worst performing quarter over the past 40 years


2014 - Qrt - 4th.png
 
Last edited:
MONTHLY

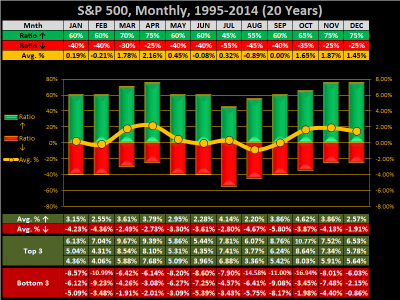
For October, covering the 12 months of the year, over the past 20 years

65% winning ratio, ranking 5th of 12

4.62% average positive gains, ranking 1st of 12 (first place)

1.65% average gains, ranking 4th of 12

-3.87% average negative gains, ranking 7th of 12

Based on the overall ranking, October ranks as the 5th best performing month over the past 20 years

2014 - Mnth - All.png
 
WEEK 40 of 52

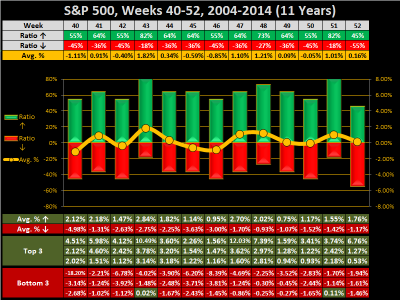
For Week 40, covering the 13 weeks of 40-52, over the past 11 years

55% winning ratio, ranking 9th of 13

2.12% average positive gains, ranking 4th of 13

-1.11% average gains, ranking 13th of 13th (last place)

-4.98% average negative gains, ranking 13th of 13 (last place)

Based on the overall ranking, week 40 ranks 12th of 13 over the past 11 years

2014 - Weekly - 40.png
 
OCTOBER

On the Daily charts, for the Month of October, covering days 1-22, over the past 11 years

There are two 4-day areas of weakness covering trading days 4-7 and 15-18

2014 - Daily - 10.jpg
 
Last edited:
PRE VS. POST IFT

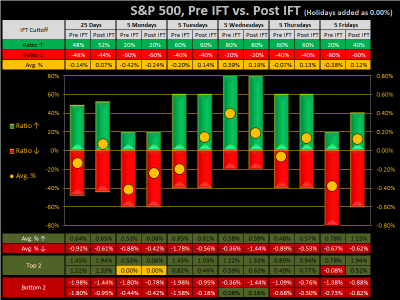
Covering the Pre-IFT vs. Post IFT deadline, for the last 25 cumulative days and last 5 Monday-Fridays each

Last 25 days show an unbiased winning/losing ratio, with weaker Pre-IFT gains (Hold)

Last 5 Mondays have very a weak 20% winning ratio and very weak gains (Best day to buy)

Last 5 Tuesdays have a decent 60% winning ratio with strong Post-IFT gains (Hold)

Last 5 Wednesdays have a very good 80% winning ratio with strong gains (Best day to sell)

Last 5 Thursdays have a decent 60% winning ratio with stronger Post-IFT average gains (Sell)

Last 5 Fridays have a very weak (combined) 30% winning ratio, with stronger Post-IFT gains (Buy)

Note: Buy on Monday, Sell on Wednesday

2014 - 4-Hour - 2015-10-02.png
 
Last edited:
Re: 4th QUARTER

Thanks JTH. I would never have guessed that. I always thought the 4th Quarter was the best or second best performer. I guess thats why my performance needs improvement, I'm out when I should be in and in when I should be out..:laugh::laugh::laugh:

FS
 
Re: PRE VS. POST IFT

Thanks JTH - You've been a "Buy and Hold" for a while and I admire that strategy.

Serious question, do your charts indicate that this a good time of year for the buy and hold investor? I am a poor market timer, but if one were to stick with it, the last three months are in one's favor statistically, is that correct? One chart shows it's the worst performing quarter, but the monthly breakdown seems pretty good if you hang in there and don't panic.
Covering the Pre-IFT vs. Post IFT deadline, for the last 25 cumulative days and last 5 Monday-Fridays each

Last 25 days show an unbiased winning/losing ratio, with weaker Pre-IFT gains (Hold)

Last 5 Mondays have very a weak 20% winning ratio and very weak gains (Best day to buy)

Last 5 Tuesdays have a decent 60% winning ratio with strong Post-IFT gains (Hold)

Last 5 Wednesdays have a very good 80% winning ratio with strong gains (Best day to sell)

Last 5 Thursdays have a decent 60% winning ratio with stronger Post-IFT average gains (Sell)

Last 5 Fridays have a very weak (combined) 30% winning ratio, with stronger Post-IFT gains (Buy)

Note: Buy on Monday, Sell on Wednesday

View attachment 35445
 
Re: PRE VS. POST IFT

Covering the Pre-IFT vs. Post IFT deadline, for the last 25 cumulative days and last 5 Monday-Fridays each

Last 25 days show an unbiased winning/losing ratio, with weaker Pre-IFT gains (Hold)

Last 5 Mondays have very a weak 20% winning ratio and very weak gains (Best day to buy)

Last 5 Tuesdays have a decent 60% winning ratio with strong Post-IFT gains (Hold)

Last 5 Wednesdays have a very good 80% winning ratio with strong gains (Best day to sell)

Last 5 Thursdays have a decent 60% winning ratio with stronger Post-IFT average gains (Sell)

Last 5 Fridays have a very weak (combined) 30% winning ratio, with stronger Post-IFT gains (Buy)

Note: Buy on Monday, Sell on Wednesday

I feel like today or tomorrow is my day to get back onto the sidelines, but your Wednesday percentage may have me stay a while longer.
 
Re: PRE VS. POST IFT

Thanks JTH. I would never have guessed that. I always thought the 4th Quarter was the best or second best performer. I guess thats why my performance needs improvement, I'm out when I should be in and in when I should be out..:laugh::laugh::laugh:FS

Thanks FS, statistics can often be misleading or manipulated to change the results, especially with a set frame of reference like 40 years. While the 4th Quarter (overall ranks 4th) over the past 40 years, over the past 30 years it ranks 3rd, and past 10 & 20 years ranks 2nd. But with less data points, it's easier to manipulate the results, which is why I use more time-data for the larger quarterly timeframe.

Thanks JTH - You've been a "Buy and Hold" for a while and I admire that strategy.

Serious question, do your charts indicate that this a good time of year for the buy and hold investor? I am a poor market timer, but if one were to stick with it, the last three months are in one's favor statistically, is that correct? One chart shows it's the worst performing quarter, but the monthly breakdown seems pretty good if you hang in there and don't panic.

For a TSP investor, I think the monthly timeframe works well. Looking at the 12-month chart, we see the average gains (Orange Line) bottoms in August (just like it did this year). Adding to this, OCT/NOV/DEC have the strongest 3-month 72% consecutive winning ratio, and strongest 3-Month consecutive average gains of 1.65%
 
Last edited:
Good morning

I've been rebuilding my statistical database, the results were posted last night.

For the PnF Charts...

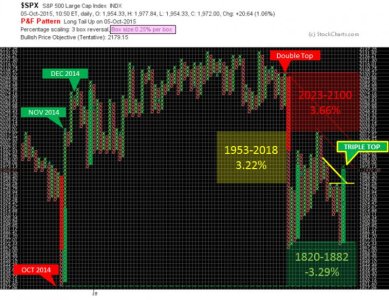
SPX triggers a Triple Top Breakout (Bullish PO 2179)

W4500 recaptures more than 50% of the previous column of Os, triggering a Long Tail Up (Bearish PO 1007.45 MET)

Transports trigger a Bearish Signal Reversed, breaking the downtrend with a Double Top Breakout (Bullish PO 8610.77)

NASDAQ 100 triggers a Long Tail Up, with a Double Top Breakout (Bullish PO 112.78)

001.jpg
 
Re: 4th QUARTER

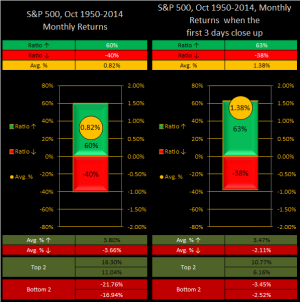
Over the past 65 Octobers, we have a 60% winning ratio with 1.11% average returns

Over those 65 Octobers, 16 closed positive on trading days 1, 2, & 3 with a 63% winning ratio with 1.38% average returns
View attachment 35451
 
Have you done any analysis of returns based on presidential election cycle? A 4 year cycle. Say this October vs October 2011, 2007, 2003 etc
 
Re: PRE VS. POST IFT

The first I have ever mentioned "Buy and Hold" and you eject to G Fund. It's like saying "Frau Blucher" in Young Frankenstein, just something one shouldn't say I suppose.

Thanks JTH - You've been a "Buy and Hold" for a while and I admire that strategy.

Serious question, do your charts indicate that this a good time of year for the buy and hold investor? I am a poor market timer, but if one were to stick with it, the last three months are in one's favor statistically, is that correct? One chart shows it's the worst performing quarter, but the monthly breakdown seems pretty good if you hang in there and don't panic.
 
Re: 4th QUARTER

REPOST: Average returns on the left chart had not included all the data (revised upwards to .82%)

Over the past 65 Octobers, we have a 60% winning ratio with 1.11% average returns

Over those 65 Octobers, 16 closed positive on trading days 1, 2, & 3 with a 63% winning ratio with 1.38% average returns

001.png
 
Have you done any analysis of returns based on presidential election cycle? A 4 year cycle. Say this October vs October 2011, 2007, 2003 etc

Hey buddy what's up!

I'm aware of the statistical cycles for presidential years, I've read about them in the Trader's Almanac, but have not spent much time analyzing them.

Reason being, I don't track the DJI which goes back much further than my SPX data (which for me, goes back to 1950).

Using the S&P 500, this leaves us 15 Presidential cycles going back to 1952 I can't use 2012-2015 because the data isn't yet written.

Looking at the data, for October, year 3 appears to have an edge over the other years, but with so few data points, the results could easily be skewed

View attachment 35455
 
Back
Top