Remember the kind of action we saw last Spring and Summer? Where the market would dive hard quickly and then come back even faster? You know, the kind of activity where the SS triggers a sell and then 5 or 6% later on the way back up triggers a buy?
It's Deja Vu all over again. Is this what we can expect this summer too? Sentiment hasn't changed a whole lot from last year. Yeah, bullishness was starting to get a bit overdone, but when the market tanked (like last week) the bears come out of the woodwork and we go right back up again. Just like last year.
The Seven Sentinels should continue to do a great job of picking out the tops, but the bottoms are another story. It's not the system's fault though. It's simply not designed for short term action. And I don't want a short term system with only 2 IFTs a month either.
If you haven't noticed, our Sentiment Survey is #1 on the tracker. It won't always work like a charm, but it's been on a roll for months now. When it went to a buy for this week I got a bit worried that I'd be left out of yet another large move higher. And then it happens. And Yogi's whispering in my ear about that deja vu thing.
Here's today's charts:

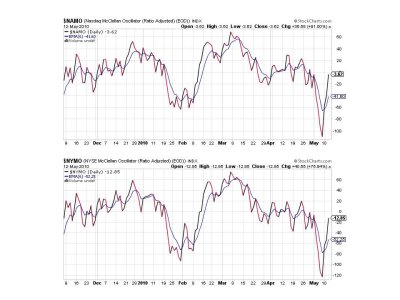
NAMO and NYMO continue to march higher. They are now in neutral territory. Room for higher prices? Could be.

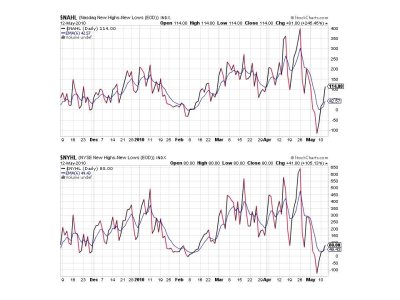
NAHL and NYHL also moved further above their respective 6 day EMAs. Still on a buy here too.

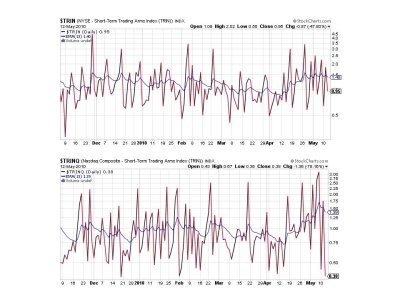
TRIN and TRINQ bounced back hard today and flipped back to buys.

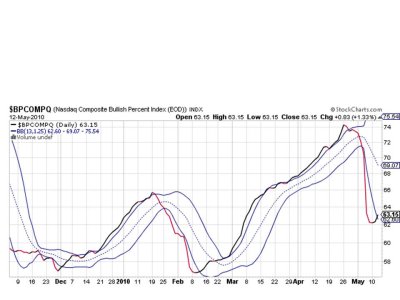
And here's number seven. BPCOMPQ penetrated the lower bollinger band to the upside. That triggers a buy for this signal.
So we have 7 of 7 signals flashing buys, which flips the system from a sell to a buy.
Be aware, that the parameters that I'm using are the original parameters for this system. The developer has started using a variation of this system a few months ago, and I don't think his new parameters would be issuing a buy after today's action. I think the only thing missing is that NYMO has yet to reach a 28 day high. It is currently at -12.85, and needs to get over a +20 to trigger a buy (as long as all 7 signals remain on a buy).
That could happen in the next day or two with follow-up upside action.
So there it is. You can jump back in tomorrow, or wait and see if NYMO gets back to a 28 day high with seven simultaneous buy signals. That would be the more conservative approach.
As a side note to this evening's post; the Top 50 have about 57% of their funds in stocks (relatively conservative for them), but the Top 15 are at 70% stock exposure.
That's it for this evening. See you tomorrow.
It's Deja Vu all over again. Is this what we can expect this summer too? Sentiment hasn't changed a whole lot from last year. Yeah, bullishness was starting to get a bit overdone, but when the market tanked (like last week) the bears come out of the woodwork and we go right back up again. Just like last year.
The Seven Sentinels should continue to do a great job of picking out the tops, but the bottoms are another story. It's not the system's fault though. It's simply not designed for short term action. And I don't want a short term system with only 2 IFTs a month either.
If you haven't noticed, our Sentiment Survey is #1 on the tracker. It won't always work like a charm, but it's been on a roll for months now. When it went to a buy for this week I got a bit worried that I'd be left out of yet another large move higher. And then it happens. And Yogi's whispering in my ear about that deja vu thing.
Here's today's charts:

NAMO and NYMO continue to march higher. They are now in neutral territory. Room for higher prices? Could be.

NAHL and NYHL also moved further above their respective 6 day EMAs. Still on a buy here too.

TRIN and TRINQ bounced back hard today and flipped back to buys.

And here's number seven. BPCOMPQ penetrated the lower bollinger band to the upside. That triggers a buy for this signal.
So we have 7 of 7 signals flashing buys, which flips the system from a sell to a buy.
Be aware, that the parameters that I'm using are the original parameters for this system. The developer has started using a variation of this system a few months ago, and I don't think his new parameters would be issuing a buy after today's action. I think the only thing missing is that NYMO has yet to reach a 28 day high. It is currently at -12.85, and needs to get over a +20 to trigger a buy (as long as all 7 signals remain on a buy).
That could happen in the next day or two with follow-up upside action.
So there it is. You can jump back in tomorrow, or wait and see if NYMO gets back to a 28 day high with seven simultaneous buy signals. That would be the more conservative approach.
As a side note to this evening's post; the Top 50 have about 57% of their funds in stocks (relatively conservative for them), but the Top 15 are at 70% stock exposure.
That's it for this evening. See you tomorrow.
