Three in a row and few places to hide. All 10 sectors fell today as the S&P 500 ended the week almost 4% lower, the worst performance since October. Better than expected earnings for 47 out of 60 companies did not seem to matter as participants felt the earnings were already priced into the market.
Of course financial regulatory overhauls threatened by the Obama administration compounded the sell-the-news reaction to earnings. The new regulations would prevent commercial banks to own, invest in or sponsor a hedge fund or a private equity fund as well as preventing them from executing proprietary trading operations unrelated to serving customers for their own profit.
Almost lost among our own domestic financial uncertainty was the overseas selling pressure that reacted to the Chinese GDP growth figures (+10.7% y/y) and high CPI readings. It should not be lost on anyone that China is considered the world's second largest economy and they are now between a rock and a hard spot over containing inflation and runaway growth with monetary tightening at the risk of facing the wrath of millions of poverty stricken farmers and peasants.
Good luck with that.
Needless to say the Seven Sentinels remained on sell today. It was notable that volume was above average again today and most major averages blew through their 50 DMAs. We also didn't see the usual bout of dip buyers loading up for an expected Monday rally. Instead, the selling intensified into the close.
Now a bounce is coming, but as I'd mentioned earlier this week, timing a bounce will not be easy. Not in this volatility. And any short term bounce is likely going to be sold quickly, so it's a very high risk trade in TSP.
For now I'm waiting to see what Monday brings. Here's today's charts:

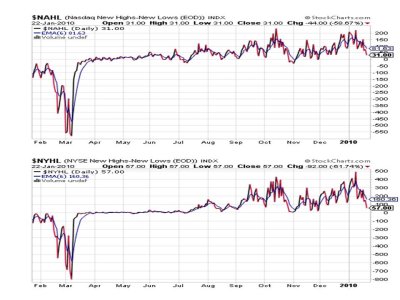
I put up a one year view of these signals today to gain a better perspective of this sell-off. We can see today's readings rival the lows between June and early October, although they are not as low as March or late October.

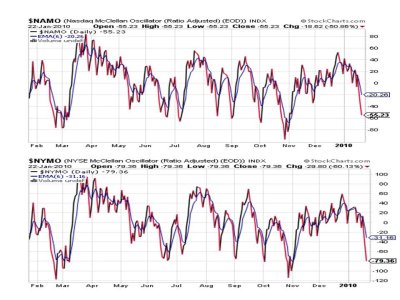
These two signals are approaching the zero line, and while currently suggesting oversold conditions, have room to move lower.

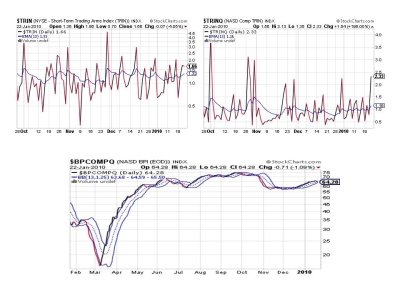
TRIN and TRINQ remain on a sell and I put up a one year view of BPCOMPQ here. It moved lower today, but is not overdone yet as it's showing an average reading as measured since early June.
I'll post Top 50 and Top 15 charts this weekend. We had another change to the Top 15. Guess which way it went?
So we remain on a sell with the Seven Sentinels with no hint of buyer interest. The close today was very bearish and Monday is a big question mark as to whether it will continue the trend of being green. As tempted as I may be to buy lower, risk management is very important too. I don't get the impression this market is going to simply do an about face and resume its previous uptrend. The bounces will come, but fear is rising, which means rallies may be fleeting. Eventually the fear will be used to begin the next upleg, but from what depth?
See you later this weekend.
Of course financial regulatory overhauls threatened by the Obama administration compounded the sell-the-news reaction to earnings. The new regulations would prevent commercial banks to own, invest in or sponsor a hedge fund or a private equity fund as well as preventing them from executing proprietary trading operations unrelated to serving customers for their own profit.
Almost lost among our own domestic financial uncertainty was the overseas selling pressure that reacted to the Chinese GDP growth figures (+10.7% y/y) and high CPI readings. It should not be lost on anyone that China is considered the world's second largest economy and they are now between a rock and a hard spot over containing inflation and runaway growth with monetary tightening at the risk of facing the wrath of millions of poverty stricken farmers and peasants.
Good luck with that.
Needless to say the Seven Sentinels remained on sell today. It was notable that volume was above average again today and most major averages blew through their 50 DMAs. We also didn't see the usual bout of dip buyers loading up for an expected Monday rally. Instead, the selling intensified into the close.
Now a bounce is coming, but as I'd mentioned earlier this week, timing a bounce will not be easy. Not in this volatility. And any short term bounce is likely going to be sold quickly, so it's a very high risk trade in TSP.
For now I'm waiting to see what Monday brings. Here's today's charts:

I put up a one year view of these signals today to gain a better perspective of this sell-off. We can see today's readings rival the lows between June and early October, although they are not as low as March or late October.

These two signals are approaching the zero line, and while currently suggesting oversold conditions, have room to move lower.

TRIN and TRINQ remain on a sell and I put up a one year view of BPCOMPQ here. It moved lower today, but is not overdone yet as it's showing an average reading as measured since early June.
I'll post Top 50 and Top 15 charts this weekend. We had another change to the Top 15. Guess which way it went?
So we remain on a sell with the Seven Sentinels with no hint of buyer interest. The close today was very bearish and Monday is a big question mark as to whether it will continue the trend of being green. As tempted as I may be to buy lower, risk management is very important too. I don't get the impression this market is going to simply do an about face and resume its previous uptrend. The bounces will come, but fear is rising, which means rallies may be fleeting. Eventually the fear will be used to begin the next upleg, but from what depth?
See you later this weekend.
