Old_School
Investor
- Reaction score
- 2
Interesting info you've presented. I've been actively trading for just a short while, so I'm trying to learn all that I can to make more educated moves.
The Forum works well on MOBILE devices without an app: Just go to: https://forum.tsptalk.com
Please read our AutoTracker policy on the
IFT deadline and remaining active. Thanks!
$ - Premium Service Content (Info) | AutoTracker Monthly Winners | Is Gmail et al, Blocking Our emails?
Find us on: Facebook & X | Posting Copyrighted Material
Join the TSP Talk AutoTracker: How to Get Started | Login | Main AutoTracker Page
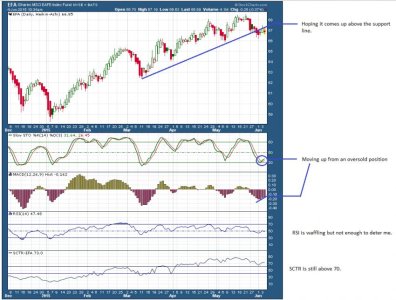
I was split between the I & S funds during the month but have rebalanced to 100% S-fund as of COB yesterday. With the I-Fund looking like it had topped out and was ready for a dip coupled with the Dollar primed to begin rising I pulled out of the I-Fund. The S-Fund looks like it still has some steam left to it (see chart) so I'll ride that up a little bit longer and then secure my gains when it looks like it's about to roll over.
I'm still work'n on my trading/investment style so we'll see soon enough if this plays out in my favor.
View attachment 33789
I joined this forum in December so I've learned a lot from reading other peoples threads. I also read the blogs and market message on Stochcharts.com as they use the charts and indicators in their analysis which I try to apply in managing my TSP. Most of those write-up are available to non-members so you do not have to join to read some of their articles.Interesting info you've presented. I've been actively trading for just a short while, so I'm trying to learn all that I can to make more educated moves.

Well I'm hoping it goes higher but we'll see what the other indicators look like if we reach that line.so 1140ish would turn what has been a losing trade around for me.
Well I'm hoping it goes higher but we'll see what the other indicators look like if we reach that line.
So if you can gain just 1% each month you could beat all the funds since inception. If TSP offered a guaranteed 1% per month or 12% annually that would be something to consider.I decided to jump out for the remainder of the month. I made my 1% this month which is good enough given the flux in this market.
I decided to jump out for the remainder of the month. I made my 1% this month which is good enough given the flux in this market. Looking to see what happens in June. Thanks for the charts Itchin.
FS

Itchn - did you move out of I yesterday or today?OUCH! Looks like I picked the wrong time to jump back in.
I jumped into the I Fund yesterday at COB so I took a beating today.Itchn - did you move out of I yesterday or today?
Here's hoping that I Fund will dramatically zoom up Monday before noon. Got some in I yesterday!I jumped into the I Fund yesterday at COB so I took a beating today.
I'm not entirely confident it will move up on Monday or anytime early next week. I think there may be some additional downward movement before heading back up. Let's hope I'm wrong.Here's hoping that I Fund will dramatically zoom up Monday before noon. Got some in I yesterday!
I fervently hope you are wrong! But what market indicators made you derive our further downfall?I'm not entirely confident it will move up on Monday or anytime early next week. I think there may be some additional downward movement before heading back up. Let's hope I'm wrong.
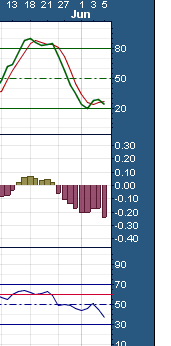
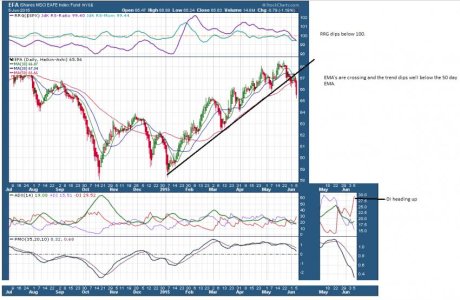
Well for starters the momentum has reversed (see RSI, MACD, and SLO Stochastic) They are heading back down to an oversold position. In the past when they have hit the bottom they usually head back up until it hits the resistance line. But this time they rolled over on me as soon as I jumped back in to the I-fund.I fervently hope you are wrong! But what market indicators made you derive our further downfall?


